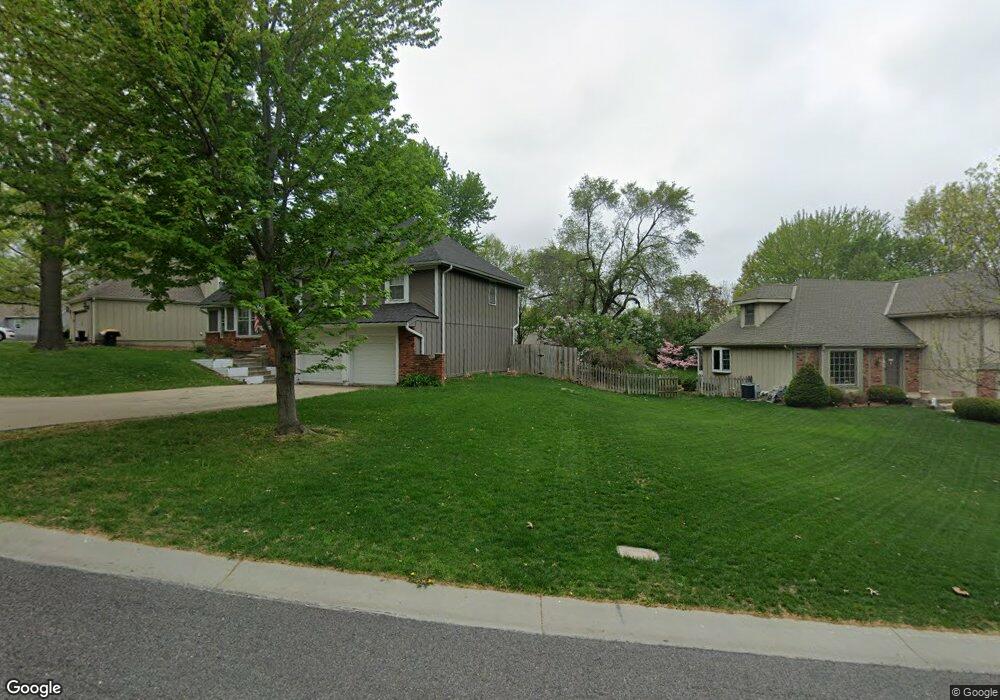
7748 Monrovia St Shawnee, KS 66216
Estimated Value: $370,000 - $396,000
4
Beds
2
Baths
1,660
Sq Ft
$229/Sq Ft
Est. Value
About This Home
This home is located at 7748 Monrovia St, Shawnee, KS 66216 and is currently estimated at $380,927, approximately $229 per square foot. 7748 Monrovia St is a home located in Johnson County with nearby schools including Mill Creek Elementary School, Trailridge Middle School, and Shawnee Mission Northwest High School.
Ownership History
Date
Name
Owned For
Owner Type
Purchase Details
Closed on
Mar 12, 2018
Sold by
Assmann Deeann M and Davis Robert L
Bought by
Assmann Deeann M and The Deeann M Assmann Trust
Current Estimated Value
Purchase Details
Closed on
Feb 13, 2003
Sold by
Phillips Carolyn C
Bought by
Assman Deeann M
Home Financials for this Owner
Home Financials are based on the most recent Mortgage that was taken out on this home.
Original Mortgage
$129,600
Interest Rate
5.84%
Purchase Details
Closed on
Sep 18, 2001
Sold by
Sedler Paul and Sedler Michelle H
Bought by
Phillips Carolyn C
Home Financials for this Owner
Home Financials are based on the most recent Mortgage that was taken out on this home.
Original Mortgage
$128,000
Interest Rate
6.88%
Create a Home Valuation Report for This Property
The Home Valuation Report is an in-depth analysis detailing your home's value as well as a comparison with similar homes in the area
Home Values in the Area
Average Home Value in this Area
Purchase History
| Date | Buyer | Sale Price | Title Company |
|---|---|---|---|
| Assmann Deeann M | -- | None Available | |
| Assman Deeann M | -- | Security Land Title Company | |
| Phillips Carolyn C | -- | Stewart Title |
Source: Public Records
Mortgage History
| Date | Status | Borrower | Loan Amount |
|---|---|---|---|
| Previous Owner | Assman Deeann M | $129,600 | |
| Previous Owner | Phillips Carolyn C | $128,000 |
Source: Public Records
Tax History Compared to Growth
Tax History
| Year | Tax Paid | Tax Assessment Tax Assessment Total Assessment is a certain percentage of the fair market value that is determined by local assessors to be the total taxable value of land and additions on the property. | Land | Improvement |
|---|---|---|---|---|
| 2024 | $4,256 | $38,548 | $8,320 | $30,228 |
| 2023 | $4,188 | $37,191 | $7,927 | $29,264 |
| 2022 | $3,822 | $33,902 | $7,206 | $26,696 |
| 2021 | $3,507 | $29,452 | $6,554 | $22,898 |
| 2020 | $3,433 | $28,543 | $6,554 | $21,989 |
| 2019 | $3,240 | $26,899 | $5,466 | $21,433 |
| 2018 | $3,073 | $25,266 | $5,466 | $19,800 |
| 2017 | $3,126 | $24,932 | $4,962 | $19,970 |
| 2016 | $3,003 | $23,644 | $4,764 | $18,880 |
| 2015 | $2,858 | $22,643 | $4,764 | $17,879 |
| 2013 | -- | $20,263 | $4,764 | $15,499 |
Source: Public Records
Map
Nearby Homes
- 7805 Long Ave
- 7736 Westgate Dr
- 12212 W 79th Terrace
- 7818 Westgate Dr
- 7526 Monrovia St
- 7913 Colony Ln
- 7502 Monrovia St
- 7917 Westgate Dr
- 7904 Rosehill Rd
- 8044 Halsey St
- 8011 Gillette St
- 12557 W 82nd Terrace
- 12403 W 72nd Terrace
- 13004 W 74th Terrace
- 8215 Rosehill Rd
- 11324 W 77th Terrace
- 12808 W 82nd St
- 7514 Caenen Lake Rd
- 8277 Monrovia St
- 11926 W 82nd Terrace
- 7740 Monrovia St
- 7756 Monrovia St
- 7732 Monrovia St
- 7745 Caenen St
- 7729 Caenen St
- 7764 Monrovia St
- 7747 Monrovia St
- 7755 Monrovia St
- 7753 Caenen St
- 7721 Caenen St
- 7739 Monrovia St
- 7757 Monrovia St
- 7724 Monrovia St
- 7761 Monrovia St
- 7763 Monrovia St
- 7713 Caenen St
- 7718 Monrovia St
- 7723 Monrovia St
- 7804 Monrovia St
- 7715 Monrovia St