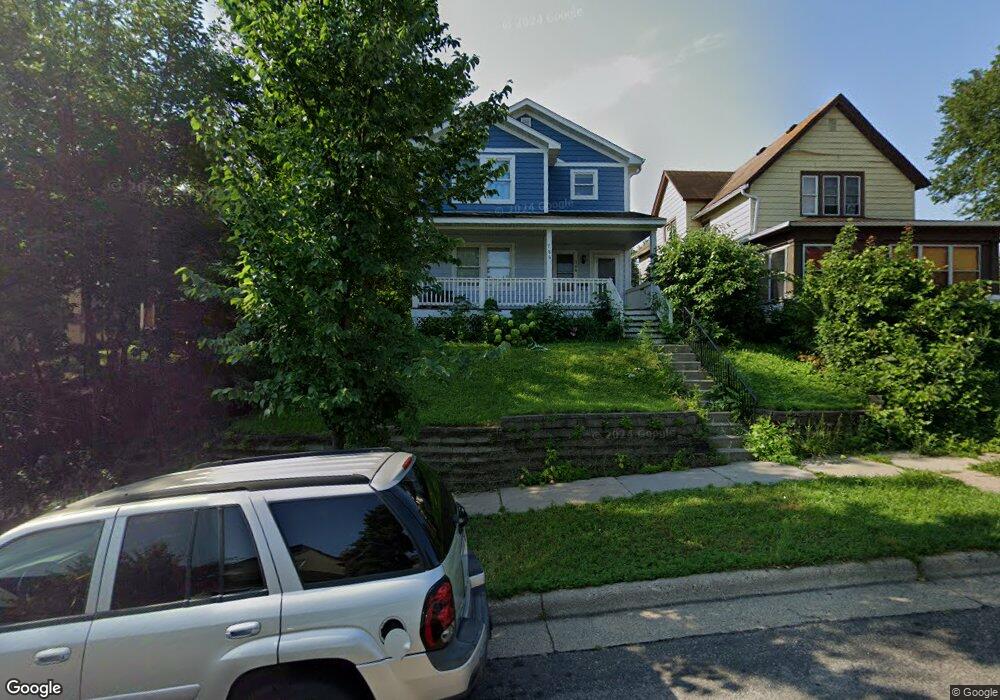
786 Sims Ave Saint Paul, MN 55106
Payne-Phalen NeighborhoodEstimated Value: $282,361 - $362,000
5
Beds
2
Baths
1,928
Sq Ft
$162/Sq Ft
Est. Value
About This Home
This home is located at 786 Sims Ave, Saint Paul, MN 55106 and is currently estimated at $312,090, approximately $161 per square foot. 786 Sims Ave is a home located in Ramsey County with nearby schools including Bruce F Vento Elementary School, Washington Technology Magnet School, and LIFE Prep School.
Ownership History
Date
Name
Owned For
Owner Type
Purchase Details
Closed on
Nov 25, 2013
Bought by
Mohamed Siyad Siyad
Current Estimated Value
Home Financials for this Owner
Home Financials are based on the most recent Mortgage that was taken out on this home.
Original Mortgage
$162,971
Outstanding Balance
$121,858
Interest Rate
4.22%
Estimated Equity
$190,232
Purchase Details
Closed on
Sep 16, 2009
Sold by
U S Bank Na
Bought by
Daytons Bluff Neighborhood Housing Servi
Purchase Details
Closed on
Mar 24, 1997
Sold by
Kedrowski Richard L and Kedrowski Jeanne B
Bought by
Welk Dean L and Wright Stephen A
Create a Home Valuation Report for This Property
The Home Valuation Report is an in-depth analysis detailing your home's value as well as a comparison with similar homes in the area
Home Values in the Area
Average Home Value in this Area
Purchase History
| Date | Buyer | Sale Price | Title Company |
|---|---|---|---|
| Mohamed Siyad Siyad | $163,000 | -- | |
| Daytons Bluff Neighborhood Housing Servi | $15,500 | -- | |
| Welk Dean L | $39,000 | -- |
Source: Public Records
Mortgage History
| Date | Status | Borrower | Loan Amount |
|---|---|---|---|
| Open | Mohamed Siyad Siyad | $162,971 |
Source: Public Records
Tax History
| Year | Tax Paid | Tax Assessment Tax Assessment Total Assessment is a certain percentage of the fair market value that is determined by local assessors to be the total taxable value of land and additions on the property. | Land | Improvement |
|---|---|---|---|---|
| 2025 | $3,956 | $286,400 | $25,000 | $261,400 |
| 2023 | $3,956 | $263,700 | $20,000 | $243,700 |
| 2022 | $4,070 | $279,600 | $20,000 | $259,600 |
| 2021 | $2,362 | $261,300 | $20,000 | $241,300 |
| 2020 | $2,446 | $167,400 | $7,000 | $160,400 |
| 2019 | $2,116 | $162,600 | $7,000 | $155,600 |
| 2018 | $2,040 | $142,300 | $7,000 | $135,300 |
| 2017 | $1,924 | $142,300 | $7,000 | $135,300 |
| 2016 | $2,116 | $0 | $0 | $0 |
| 2015 | $2,454 | $147,200 | $7,000 | $140,200 |
| 2014 | $242 | $0 | $0 | $0 |
Source: Public Records
Map
Nearby Homes
- 758 Jenks Ave
- 911 Sims Ave
- 829 Lawson Ave E
- 687 Sims Ave
- 694 York Ave
- 792 Cook Ave E
- 893 Jenks Ave
- 701 Jenks Ave
- 680 Lawson Ave E
- 892 Cook Ave E
- 878 Magnolia Ave E
- 941 Cypress St
- 813 Jessamine Ave E
- 938 Cypress St
- 608 Wells St
- 896 Jessamine Ave E
- 624 Cook Ave E
- 1013 Sims Ave
- 760 Minnehaha Ave E
- 620 Cook Ave E
Your Personal Tour Guide
Ask me questions while you tour the home.