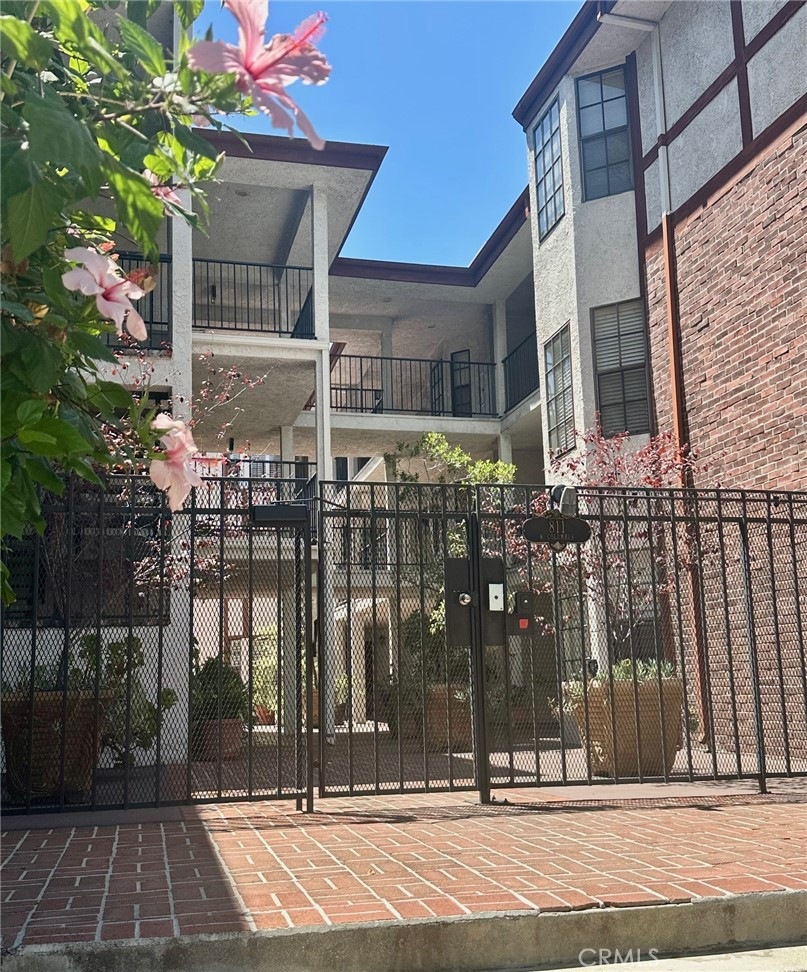
811 N Columbus Ave Unit 18 Glendale, CA 91203
Glenwood NeighborhoodEstimated payment $4,480/month
Highlights
- 0.53 Acre Lot
- End Unit
- 2 Car Attached Garage
- Herbert Hoover High School Rated A-
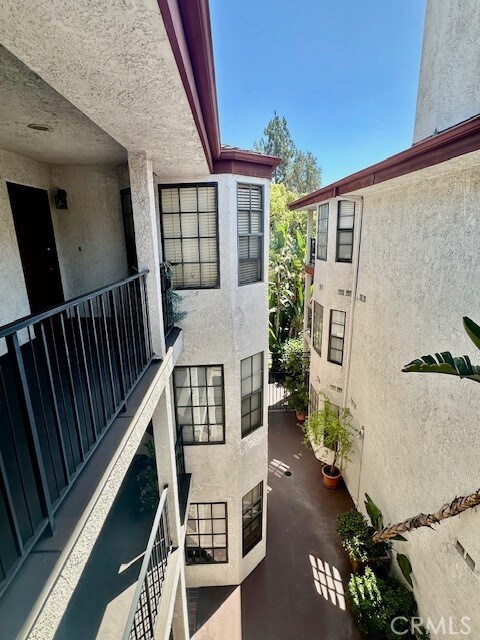
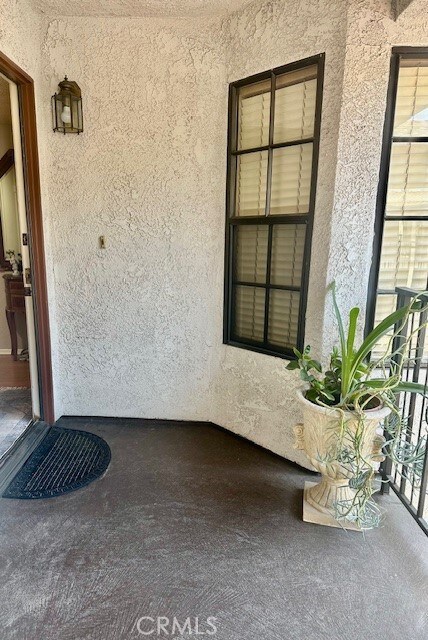
- Balcony
- Laundry Room
About This Home
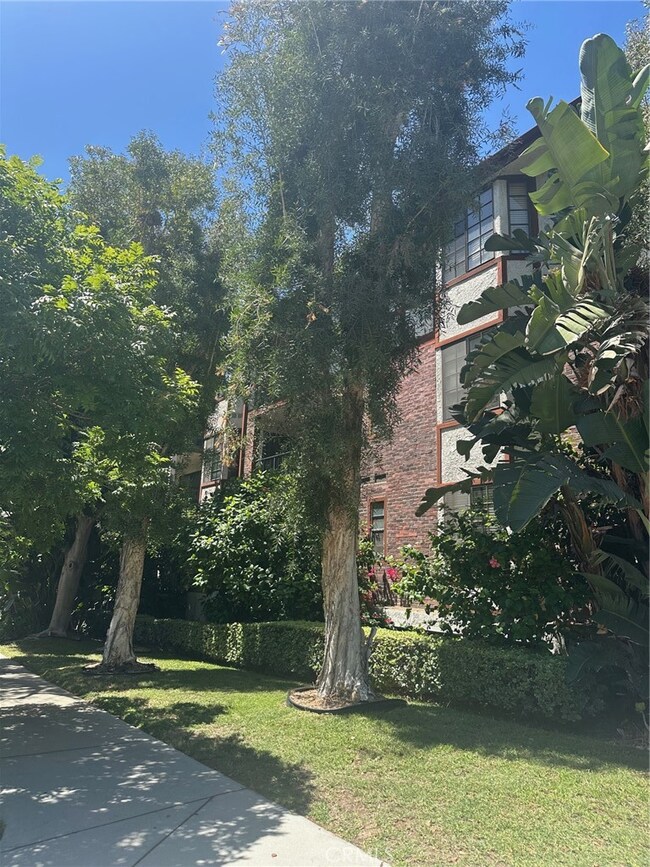
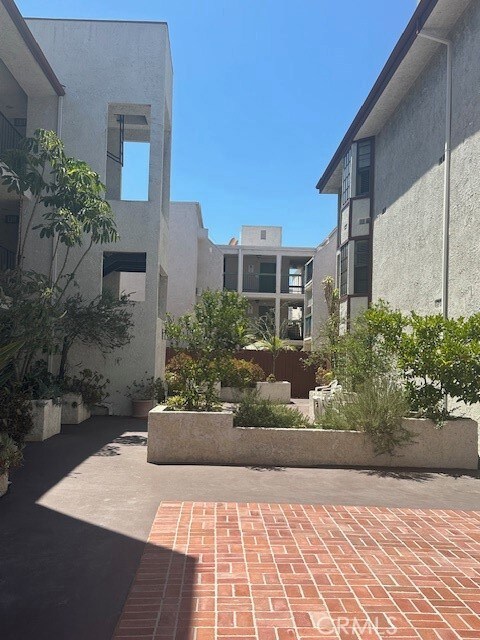
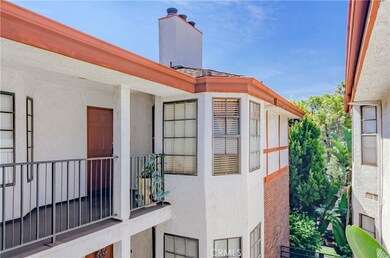
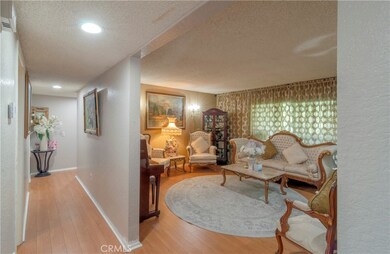
Charming Condo in Prime Glendale Location. Welcome to Unit 18 at 811 N. Columbus Avenue—a beautifully maintained condo in the heart of one of Glendale’s most desirable neighborhoods. This light-filled corner unit offers a perfect blend of comfort, style, and convenience, making it an ideal home for first-time buyers, downsizers, or savvy investors. Step inside to find a thoughtfully designed layout featuring 2 spacious bedrooms and 2 bathrooms, a bright living area, and a private balcony perfect for enjoying your morning coffee or evening breeze. The kitchen offers ample cabinetry and counter space, ready for your personal touches. Located in a well-kept and quiet complex, this unit includes central air/heat, in-unit laundry with washer /dryer included and assigned parking. Situated near the heart of Glendale, you're just minutes from The Americana at Brand, the Galleria, Whole Foods, dining, parks, and easy freeway access to Downtown LA, Burbank, and Pasadena.
Listing Agent
Engel & Völkers Pasadena Brokerage Phone: 818-261-7626 License #01487636 Listed on: 08/01/2025

Property Details
Home Type
- Condominium
Est. Annual Taxes
- $3,612
Year Built
- Built in 1981
Lot Details
- End Unit
- 1 Common Wall
HOA Fees
- $490 Monthly HOA Fees
Parking
- 2 Car Attached Garage
Home Design
- Entry on the 3rd floor
Interior Spaces
- 1,277 Sq Ft Home
- 3-Story Property
Kitchen
- Gas Oven
- Built-In Range
- Dishwasher
Bedrooms and Bathrooms
- 2 Main Level Bedrooms
- 2 Full Bathrooms
Laundry
- Laundry Room
- Dryer
Outdoor Features
- Balcony
- Exterior Lighting
Utilities
- Central Heating and Cooling System
Community Details
- 24 Units
- Columbus Corner Association, Phone Number (877) 278-5598
- Ontrack HOA Mgt HOA
- Maintained Community
Listing and Financial Details
- Tax Lot 1
- Tax Tract Number 38928
- Assessor Parcel Number 5636015120
- $142 per year additional tax assessments
Map
Home Values in the Area
Average Home Value in this Area
Tax History
| Year | Tax Paid | Tax Assessment Tax Assessment Total Assessment is a certain percentage of the fair market value that is determined by local assessors to be the total taxable value of land and additions on the property. | Land | Improvement |
|---|---|---|---|---|
| 2025 | $3,612 | $333,095 | $238,965 | $94,130 |
| 2024 | $3,612 | $326,565 | $234,280 | $92,285 |
| 2023 | $3,529 | $320,163 | $229,687 | $90,476 |
| 2022 | $3,464 | $313,886 | $225,184 | $88,702 |
| 2021 | $3,399 | $307,732 | $220,769 | $86,963 |
| 2019 | $3,266 | $298,607 | $214,222 | $84,385 |
| 2018 | $3,215 | $292,753 | $210,022 | $82,731 |
| 2016 | $3,055 | $281,386 | $201,867 | $79,519 |
| 2015 | $2,993 | $277,160 | $198,835 | $78,325 |
| 2014 | $2,970 | $271,732 | $194,941 | $76,791 |
Property History
| Date | Event | Price | List to Sale | Price per Sq Ft |
|---|---|---|---|---|
| 08/27/2025 08/27/25 | Pending | -- | -- | -- |
| 08/10/2025 08/10/25 | Price Changed | $699,999 | -2.8% | $548 / Sq Ft |
| 08/01/2025 08/01/25 | For Sale | $720,000 | -- | $564 / Sq Ft |
Purchase History
| Date | Type | Sale Price | Title Company |
|---|---|---|---|
| Interfamily Deed Transfer | -- | None Available | |
| Interfamily Deed Transfer | -- | None Available | |
| Quit Claim Deed | -- | -- |
Source: California Regional Multiple Listing Service (CRMLS)
MLS Number: GD25169529
APN: 5636-015-120
Disclaimer: Certain information contained herein is derived from information provided by parties other than Homes.com. All information provided is deemed reliable, but is not guaranteed to be accurate and should be independently verified.
![]() The multiple listing data appearing on this website, or contained in reports produced therefrom, is owned and copyrighted by California Regional Multiple Listing Service, Inc. ("CRMLS") and is protected by all applicable copyright laws. Information provided is for viewer's personal, non-commercial use and may not be used for any purpose other than to identify prospective properties the viewer may be interested in purchasing. All listing data, including but not limited to square footage and lot size is believed to be accurate, but the listing Agent, listing Broker and CRMLS and its affiliates do not warrant or guarantee such accuracy. The viewer should independently verify the listed data prior to making any decisions based on such information by personal inspection and/or contacting a real estate professional.
The multiple listing data appearing on this website, or contained in reports produced therefrom, is owned and copyrighted by California Regional Multiple Listing Service, Inc. ("CRMLS") and is protected by all applicable copyright laws. Information provided is for viewer's personal, non-commercial use and may not be used for any purpose other than to identify prospective properties the viewer may be interested in purchasing. All listing data, including but not limited to square footage and lot size is believed to be accurate, but the listing Agent, listing Broker and CRMLS and its affiliates do not warrant or guarantee such accuracy. The viewer should independently verify the listed data prior to making any decisions based on such information by personal inspection and/or contacting a real estate professional.
Based on information from California Regional Multiple Listing Service, Inc. and /or other sources. All data, including all measurements and calculations of area, is obtained from various sources and has not been, and will not be, verified by broker or MLS. All information should be independently reviewed and verified for accuracy. Properties may or may not be listed by the office/agent presenting the information
- 409 Burchett St Unit 315
- 409 Burchett St Unit 220
- 408 Burchett St Unit 5
- 350 Burchett St Unit 101
- 345 Pioneer Dr Unit 1705
- 343 Pioneer Dr Unit 905
- 437 W Glenoaks Blvd
- 612 N Columbus Ave Unit 101
- 250 W Fairview Ave Unit 301
- 501 W Doran St
- 1114 San Rafael Ave Unit 7
- 333 Milford St Unit 105
- 1207 N Columbus Ave
- 1118 N Central Ave Unit 17
- 537 W Stocker St Unit 5
- 655 Alexander St Unit 3
- 0 N Idlewood Rd
- 570 W Stocker St Unit 201
- 377 W California Ave
- 657 W Milford St