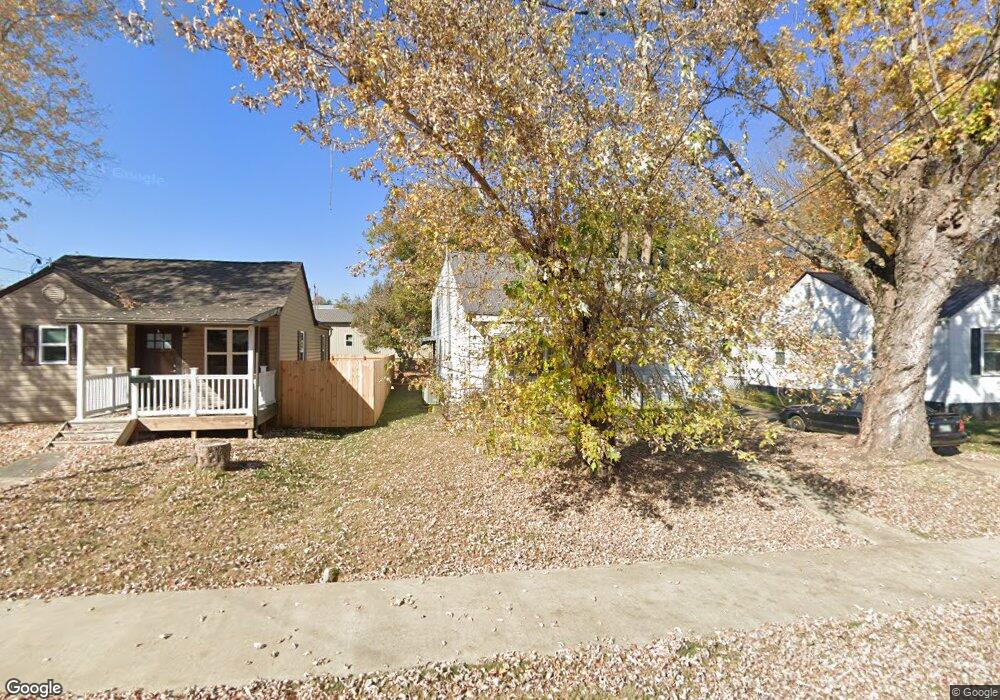
818 Carson St Greeneville, TN 37743
Estimated Value: $173,516 - $256,000
5
Beds
5
Baths
1,961
Sq Ft
$113/Sq Ft
Est. Value
About This Home
This home is located at 818 Carson St, Greeneville, TN 37743 and is currently estimated at $222,379, approximately $113 per square foot. 818 Carson St is a home located in Greene County with nearby schools including Greeneville Middle School, Greeneville High School, and Greeneville Adventist Academy.
Ownership History
Date
Name
Owned For
Owner Type
Purchase Details
Closed on
Mar 26, 2014
Sold by
Gomolkam Kyle
Bought by
Third Base Investments Llc
Current Estimated Value
Home Financials for this Owner
Home Financials are based on the most recent Mortgage that was taken out on this home.
Original Mortgage
$40,000
Outstanding Balance
$30,120
Interest Rate
4.4%
Mortgage Type
New Conventional
Estimated Equity
$192,259
Purchase Details
Closed on
May 22, 2007
Sold by
Beamer John P
Bought by
Gomolkam Kyle
Home Financials for this Owner
Home Financials are based on the most recent Mortgage that was taken out on this home.
Original Mortgage
$51,500
Interest Rate
6.16%
Purchase Details
Closed on
Jul 27, 2001
Sold by
Love Anna M and Love James S
Bought by
Beamer John P
Home Financials for this Owner
Home Financials are based on the most recent Mortgage that was taken out on this home.
Original Mortgage
$50,000
Interest Rate
7.09%
Create a Home Valuation Report for This Property
The Home Valuation Report is an in-depth analysis detailing your home's value as well as a comparison with similar homes in the area
Purchase History
| Date | Buyer | Sale Price | Title Company |
|---|---|---|---|
| Third Base Investments Llc | $50,000 | -- | |
| Gomolkam Kyle | $64,375 | -- | |
| Gomolka Kyle | $64,375 | -- | |
| Beamer John P | $60,000 | -- |
Source: Public Records
Mortgage History
| Date | Status | Borrower | Loan Amount |
|---|---|---|---|
| Open | Third Base Investments Llc | $40,000 | |
| Previous Owner | Beamer John P | $51,500 | |
| Previous Owner | Beamer John P | $50,000 |
Source: Public Records
Tax History
| Year | Tax Paid | Tax Assessment Tax Assessment Total Assessment is a certain percentage of the fair market value that is determined by local assessors to be the total taxable value of land and additions on the property. | Land | Improvement |
|---|---|---|---|---|
| 2025 | $1,112 | $33,875 | $3,850 | $30,025 |
| 2024 | $1,112 | $33,875 | $3,850 | $30,025 |
| 2023 | $1,112 | $33,875 | $0 | $0 |
| 2022 | $939 | $22,550 | $2,500 | $20,050 |
| 2021 | $939 | $22,550 | $2,500 | $20,050 |
| 2020 | $939 | $22,550 | $2,500 | $20,050 |
| 2019 | $939 | $22,550 | $2,500 | $20,050 |
| 2018 | $909 | $22,550 | $2,500 | $20,050 |
| 2017 | $616 | $15,500 | $2,500 | $13,000 |
| 2016 | $601 | $15,500 | $2,500 | $13,000 |
| 2015 | $601 | $15,500 | $2,500 | $13,000 |
| 2014 | $575 | $15,500 | $2,500 | $13,000 |
Source: Public Records
Map
Nearby Homes
- 106 Anderson St
- 1119 Forest St
- 220 Susong Ln
- 416 W Main St
- 402 W Irish St
- 111 Park Place
- 301 S Irish St
- 217 S Irish St
- 105 Robinson St
- 206 S Cutler St
- 215 S Irish St
- Tbd W Summer St
- 108 Plymouth Hill
- 105 Idletime Dr
- 205 Farmington Dr
- 1140 W Irish St
- 124 Keeneland Cir
- Tbd S Mckee St
- 1042 W Vann Rd
- 115 Cedar St
Your Personal Tour Guide
Ask me questions while you tour the home.