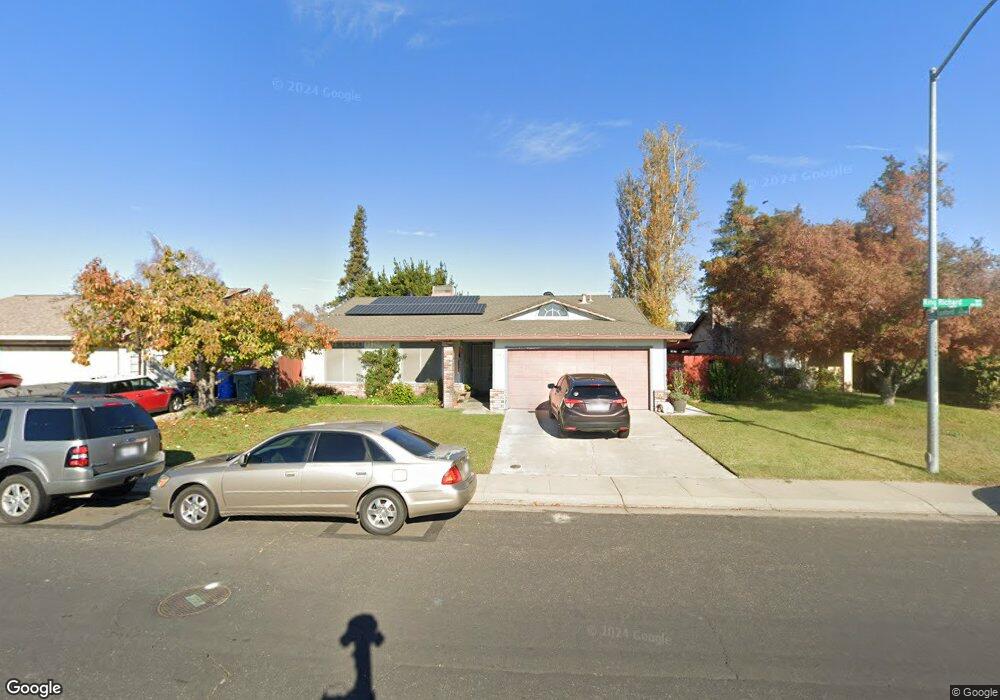
865 King Richard Way Manteca, CA 95336
Downtown Manteca NeighborhoodEstimated Value: $466,635 - $513,000
3
Beds
2
Baths
1,358
Sq Ft
$364/Sq Ft
Est. Value
About This Home
This home is located at 865 King Richard Way, Manteca, CA 95336 and is currently estimated at $494,159, approximately $363 per square foot. 865 King Richard Way is a home located in San Joaquin County with nearby schools including Neil Hafley Elementary School, East Union High School, and BE.TECH Charter High School.
Ownership History
Date
Name
Owned For
Owner Type
Purchase Details
Closed on
Aug 14, 2025
Sold by
Rossi Joe and Rossi Marci J
Bought by
Rossi Living Trust and Rossi
Current Estimated Value
Purchase Details
Closed on
Nov 9, 1999
Sold by
Rossi Joe and Rossi Marci
Bought by
Rossi Joe and Rossi Marci J
Home Financials for this Owner
Home Financials are based on the most recent Mortgage that was taken out on this home.
Original Mortgage
$136,850
Interest Rate
7.82%
Mortgage Type
FHA
Purchase Details
Closed on
Jun 15, 1998
Sold by
Nicholson Lenn F
Bought by
Rossi Joe and Rossi Marci
Home Financials for this Owner
Home Financials are based on the most recent Mortgage that was taken out on this home.
Original Mortgage
$124,716
Interest Rate
7.11%
Mortgage Type
FHA
Create a Home Valuation Report for This Property
The Home Valuation Report is an in-depth analysis detailing your home's value as well as a comparison with similar homes in the area
Home Values in the Area
Average Home Value in this Area
Purchase History
| Date | Buyer | Sale Price | Title Company |
|---|---|---|---|
| Rossi Living Trust | -- | None Listed On Document | |
| Rossi Joe | -- | Chicago Title Co | |
| Rossi Joe | $125,500 | Central Valley Title Company |
Source: Public Records
Mortgage History
| Date | Status | Borrower | Loan Amount |
|---|---|---|---|
| Previous Owner | Rossi Joe | $136,850 | |
| Previous Owner | Rossi Joe | $124,716 |
Source: Public Records
Tax History Compared to Growth
Tax History
| Year | Tax Paid | Tax Assessment Tax Assessment Total Assessment is a certain percentage of the fair market value that is determined by local assessors to be the total taxable value of land and additions on the property. | Land | Improvement |
|---|---|---|---|---|
| 2025 | $2,164 | $200,375 | $63,863 | $136,512 |
| 2024 | $2,102 | $196,447 | $62,611 | $133,836 |
| 2023 | $2,075 | $192,596 | $61,384 | $131,212 |
| 2022 | $2,042 | $188,821 | $60,181 | $128,640 |
| 2021 | $2,019 | $185,119 | $59,001 | $126,118 |
| 2020 | $1,936 | $183,222 | $58,397 | $124,825 |
| 2019 | $1,910 | $179,630 | $57,252 | $122,378 |
| 2018 | $1,883 | $176,109 | $56,130 | $119,979 |
| 2017 | $1,854 | $172,657 | $55,030 | $117,627 |
| 2016 | $1,808 | $169,274 | $53,952 | $115,322 |
| 2014 | $1,680 | $163,465 | $52,100 | $111,365 |
Source: Public Records
Map
Nearby Homes
- 873 Nottingham Dr
- 1624 S Highway 99 Unit 19
- 889 Harvest Mill Dr
- 11097 S Union Rd
- 1870 Pecanwood Ave
- 2021 Holbrook Place
- 1660 Kingwood Ave
- 2254 Maple Hollow Ln
- 2253 Maple Hollow Ln
- 447 Ericwood Ct
- 1309 Ruffino Ct
- 1414 Pajaro Ave Unit 14
- 1394 Pajaro Ave Unit 17
- 6288 E Lathrop Rd
- 2418 Finchwood Landing Ln
- 1340 Crimson Place
- 1379 Maple Valley St
- 2066 Hyde Park Place
- 2367 Bellchase Dr
- 1072 Glen Abbey Dr
- 877 King Richard Way
- 857 King Richard Way
- 868 Buckingham Dr
- 874 Buckingham Dr
- 856 Buckingham Dr
- 883 King Richard Way
- 849 King Richard Way
- 882 Buckingham Dr
- 848 Buckingham Dr
- 1949 Tuxford Place
- 1948 Tuxford Place
- 841 King Richard Way
- 1972 Sherwood Place
- 1988 Sherwood Place
- 1937 Tuxford Place
- 1950 Sherwood Place
- 1936 Tuxford Place
- 1947 Hoyt Ln
- 867 Buckingham Dr
- 859 Buckingham Dr