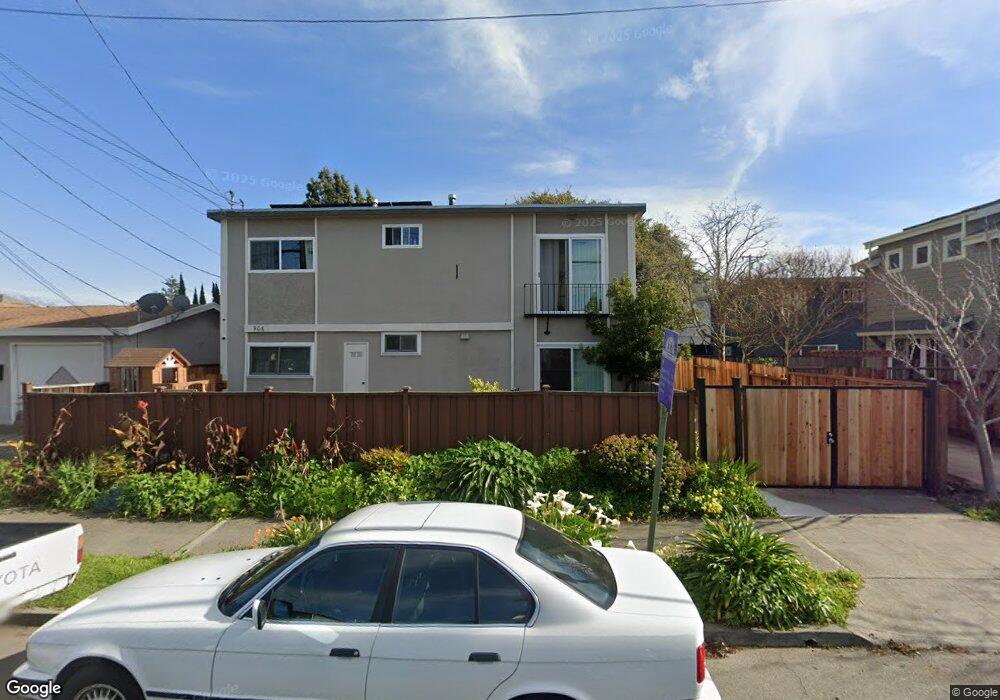
906 Channing Way Berkeley, CA 94710
West Berkeley NeighborhoodEstimated Value: $1,737,000 - $2,220,000
8
Beds
4
Baths
3,464
Sq Ft
$574/Sq Ft
Est. Value
About This Home
This home is located at 906 Channing Way, Berkeley, CA 94710 and is currently estimated at $1,987,000, approximately $573 per square foot. 906 Channing Way is a home located in Alameda County with nearby schools including Rosa Parks Elementary School, Ruth Acty Elementary, and Berkeley Arts Magnet at Whittier School.
Ownership History
Date
Name
Owned For
Owner Type
Purchase Details
Closed on
Oct 16, 2019
Sold by
Settachatgul Supalak
Bought by
Settachatgul Kiti
Current Estimated Value
Home Financials for this Owner
Home Financials are based on the most recent Mortgage that was taken out on this home.
Original Mortgage
$1,368,000
Outstanding Balance
$1,195,971
Interest Rate
3.4%
Mortgage Type
New Conventional
Estimated Equity
$791,029
Purchase Details
Closed on
Oct 15, 2019
Sold by
Williams Kaila Greene and Williams Samuel J
Bought by
Settachatgul Calvin and Settachatgul Kiti
Home Financials for this Owner
Home Financials are based on the most recent Mortgage that was taken out on this home.
Original Mortgage
$1,368,000
Outstanding Balance
$1,195,971
Interest Rate
3.4%
Mortgage Type
New Conventional
Estimated Equity
$791,029
Purchase Details
Closed on
Sep 4, 2001
Sold by
Arceneaux Andrew J and Will Of Alethia Arceneaux
Bought by
Williams Kaila Greene and Arceneaux Kelsi M
Create a Home Valuation Report for This Property
The Home Valuation Report is an in-depth analysis detailing your home's value as well as a comparison with similar homes in the area
Home Values in the Area
Average Home Value in this Area
Purchase History
| Date | Buyer | Sale Price | Title Company |
|---|---|---|---|
| Settachatgul Kiti | -- | Fidelity National Title Co | |
| Settachatgul Calvin | $1,710,000 | Fidelity National Title Co | |
| Williams Kaila Greene | -- | -- | |
| Williams Kaila Greene | -- | -- |
Source: Public Records
Mortgage History
| Date | Status | Borrower | Loan Amount |
|---|---|---|---|
| Open | Settachatgul Calvin | $1,368,000 |
Source: Public Records
Tax History
| Year | Tax Paid | Tax Assessment Tax Assessment Total Assessment is a certain percentage of the fair market value that is determined by local assessors to be the total taxable value of land and additions on the property. | Land | Improvement |
|---|---|---|---|---|
| 2025 | $27,926 | $1,863,107 | $656,178 | $1,213,929 |
| 2024 | $27,926 | $1,826,444 | $643,314 | $1,190,130 |
| 2023 | $27,353 | $1,797,500 | $630,702 | $1,166,798 |
| 2022 | $26,877 | $1,755,257 | $618,336 | $1,143,921 |
| 2021 | $26,950 | $1,720,715 | $606,216 | $1,121,499 |
| 2020 | $25,614 | $1,710,000 | $600,000 | $1,110,000 |
| 2019 | $6,593 | $195,333 | $58,542 | $136,791 |
| 2018 | $6,409 | $191,503 | $57,394 | $134,109 |
| 2017 | $6,147 | $187,749 | $56,269 | $131,480 |
| 2016 | $9,755 | $184,069 | $55,166 | $128,903 |
| 2015 | $5,620 | $181,303 | $54,337 | $126,966 |
| 2014 | $5,713 | $177,753 | $53,273 | $124,480 |
Source: Public Records
Map
Nearby Homes
- 2512 9th St Unit 10
- 931 Bancroft Way
- 2327 10th St Unit 4
- 1039 Channing Way
- 2238 7th St
- 2241 Ninth St
- 1092 Dwight Way
- 2220 7th St
- 1050 Allston Way
- 1118 Dwight Way
- 1142 Dwight Way
- 2324 Browning St
- 1013 Addison St
- 2144 Curtis St
- 2013 9th St
- 1034 Grayson St
- 2747 San Pablo Ave Unit 507
- 2751 Wallace St
- 1919 Curtis St
- 940 Delaware St
- 906 Channing Way Unit D
- 906 Channing Way Unit C
- 900 Channing Way
- 910 Channing Way
- 2411 7th St
- 914 Channing Way
- 2413 7th St
- 2410 8th St
- 2345 7th St
- 2415 7th St
- 907 Channing Way
- 850 Channing Way
- 922 Channing Way
- 2408 8th St
- 911 Channing Way
- 2414 8th St
- 913 Channing Way
- 2404 7th St
- 2341 7th St
- 917 Channing Way
Your Personal Tour Guide
Ask me questions while you tour the home.