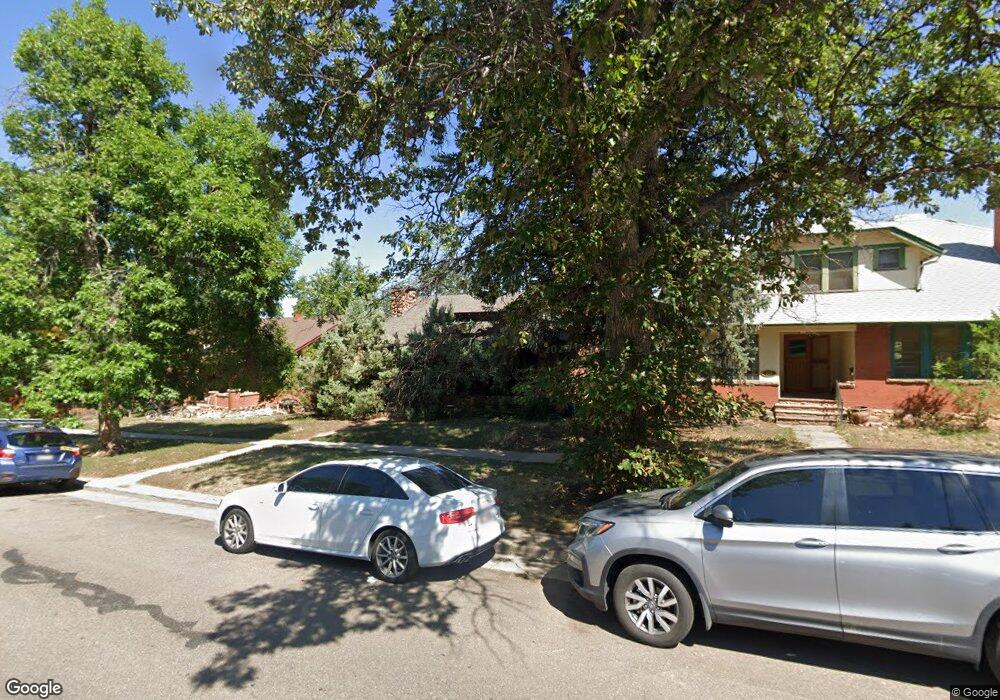
960 13th St Boulder, CO 80302
University Hill NeighborhoodEstimated Value: $1,391,000 - $1,690,000
3
Beds
2
Baths
1,482
Sq Ft
$1,036/Sq Ft
Est. Value
About This Home
This home is located at 960 13th St, Boulder, CO 80302 and is currently estimated at $1,534,662, approximately $1,035 per square foot. 960 13th St is a home located in Boulder County with nearby schools including Flatirons Elementary School, Manhattan Middle School of the Arts & Academics, and Boulder High School.
Ownership History
Date
Name
Owned For
Owner Type
Purchase Details
Closed on
Jun 19, 1998
Sold by
Lair Johnson Sally Brown and Lair Cindy M
Bought by
Johnson Sally Brown
Current Estimated Value
Home Financials for this Owner
Home Financials are based on the most recent Mortgage that was taken out on this home.
Original Mortgage
$210,000
Outstanding Balance
$38,927
Interest Rate
7.17%
Estimated Equity
$1,495,735
Purchase Details
Closed on
Aug 29, 1988
Bought by
Johnson Sally Brown and Lair Cindy M
Purchase Details
Closed on
Aug 12, 1980
Bought by
Johnson Sally Brown and Lair Cindy M
Create a Home Valuation Report for This Property
The Home Valuation Report is an in-depth analysis detailing your home's value as well as a comparison with similar homes in the area
Home Values in the Area
Average Home Value in this Area
Purchase History
We collect this data history from publicly available records. To have your information removed, we recommend requesting removal directly through your county’s website.
| Date | Buyer | Sale Price | Title Company |
|---|---|---|---|
| Johnson Sally Brown | -- | -- | |
| Johnson Sally Brown | $123,200 | -- | |
| Johnson Sally Brown | -- | -- |
Source: Public Records
Mortgage History
We collect this data history from publicly available records. To have your information removed, we recommend requesting removal directly through your county’s website.
| Date | Status | Borrower | Loan Amount |
|---|---|---|---|
| Open | Johnson Sally Brown | $210,000 |
Source: Public Records
Tax History
| Year | Tax Paid | Tax Assessment Tax Assessment Total Assessment is a certain percentage of the fair market value that is determined by local assessors to be the total taxable value of land and additions on the property. | Land | Improvement |
|---|---|---|---|---|
| 2025 | $6,993 | $82,794 | $54,300 | $28,494 |
| 2024 | $6,993 | $82,794 | $54,300 | $28,494 |
| 2023 | $6,872 | $86,276 | $55,329 | $34,632 |
| 2022 | $6,175 | $73,441 | $45,335 | $28,106 |
| 2021 | $5,888 | $75,554 | $46,639 | $28,915 |
| 2020 | $5,512 | $70,478 | $38,825 | $31,653 |
| 2019 | $5,428 | $70,478 | $38,825 | $31,653 |
| 2018 | $4,860 | $63,252 | $34,776 | $28,476 |
| 2017 | $4,708 | $69,929 | $38,447 | $31,482 |
| 2016 | $4,391 | $58,681 | $31,840 | $26,841 |
| 2015 | $4,158 | $51,000 | $25,154 | $25,846 |
| 2014 | $4,288 | $51,000 | $25,154 | $25,846 |
Source: Public Records
Map
Nearby Homes
- 1031 14th St
- 1200 College Ave Unit 118
- 1200 College Ave Unit 121
- 961 16th St Unit 8
- 961 16th St Unit 5
- 1090 11th St
- 856 10th St
- 815 16th St
- 789 15th St
- 757 12th St
- 1125 10th St
- 715 14th St
- 650 12th St
- 720 17th St
- 800 Grant Place
- 1065 University Ave Unit 105
- 920 University Ave
- 850 20th St Unit 406
- 850 20th St Unit 502
- 850 20th St Unit 203
Your Personal Tour Guide
Ask me questions while you tour the home.