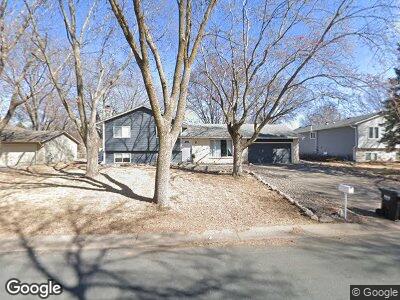
9936 Deerwood Ln N Maple Grove, MN 55369
Estimated Value: $371,000 - $399,000
3
Beds
2
Baths
2,160
Sq Ft
$179/Sq Ft
Est. Value
About This Home
This home is located at 9936 Deerwood Ln N, Maple Grove, MN 55369 and is currently estimated at $385,566, approximately $178 per square foot. 9936 Deerwood Ln N is a home located in Hennepin County with nearby schools including Elm Creek Elementary School, Osseo Middle School, and Osseo Senior High School.
Ownership History
Date
Name
Owned For
Owner Type
Purchase Details
Closed on
Nov 20, 2020
Sold by
Lindsey Sara J and Lindsey Joshua
Bought by
Dilly Ashton and Sanders Kelsey
Current Estimated Value
Home Financials for this Owner
Home Financials are based on the most recent Mortgage that was taken out on this home.
Original Mortgage
$266,880
Outstanding Balance
$240,714
Interest Rate
2.8%
Mortgage Type
New Conventional
Estimated Equity
$144,852
Purchase Details
Closed on
Jun 9, 2020
Sold by
Guardian And Conservator Services Llc
Bought by
Shovelin John E and Shovelin John Edward
Purchase Details
Closed on
Nov 8, 2019
Sold by
Durant Nadya Darina
Bought by
Shovelin John E
Purchase Details
Closed on
Jul 19, 2019
Sold by
Shovelin John Edvard
Bought by
Durant Nadiya Darina
Create a Home Valuation Report for This Property
The Home Valuation Report is an in-depth analysis detailing your home's value as well as a comparison with similar homes in the area
Home Values in the Area
Average Home Value in this Area
Purchase History
| Date | Buyer | Sale Price | Title Company |
|---|---|---|---|
| Dilly Ashton | $333,600 | Modern Title Llc | |
| Shovelin John E | $210,000 | Network Title Inc | |
| Shovelin John E | -- | None Available | |
| Durant Nadiya Darina | -- | None Available | |
| Dilly Ashton Ashton | $333,600 | -- |
Source: Public Records
Mortgage History
| Date | Status | Borrower | Loan Amount |
|---|---|---|---|
| Open | Dilly Ashton | $266,880 | |
| Previous Owner | Shovelin John Edward | $50,000 | |
| Closed | Dilly Ashton Ashton | $266,880 |
Source: Public Records
Tax History Compared to Growth
Tax History
| Year | Tax Paid | Tax Assessment Tax Assessment Total Assessment is a certain percentage of the fair market value that is determined by local assessors to be the total taxable value of land and additions on the property. | Land | Improvement |
|---|---|---|---|---|
| 2023 | $4,462 | $382,600 | $131,600 | $251,000 |
| 2022 | $3,036 | $381,800 | $106,600 | $275,200 |
| 2021 | $2,912 | $261,400 | $80,300 | $181,100 |
| 2020 | $3,073 | $242,200 | $66,300 | $175,900 |
| 2019 | $3,060 | $232,400 | $63,000 | $169,400 |
| 2018 | $2,934 | $220,000 | $62,000 | $158,000 |
| 2017 | $2,777 | $190,800 | $52,000 | $138,800 |
| 2016 | $2,787 | $189,100 | $57,000 | $132,100 |
| 2015 | $2,804 | $185,600 | $59,000 | $126,600 |
| 2014 | -- | $170,600 | $56,500 | $114,100 |
Source: Public Records
Map
Nearby Homes
- 11481 98th Ave N
- 11268 97th Place N
- 9700 Forestview Ln N
- 11082 97th Place N
- 12220 101st Ave N
- 12254 97th Ave N
- 6866 Zachary Ln N
- 14383 103rd Place N
- 10534 Maple Valley Dr
- 14399 103rd Place N
- 12612 95th Place N
- 9500 Trenton Ln N
- 14927 106th Ave N
- 14947 106th Ave N
- 9383 Union Terrace Ln N
- 10557 Wellington Ln N
- 9155 Goldenrod Ln N
- 9957 Nathan Ln N
- 9790 99th Ave N
- 14550 107th Place N
- 9936 Deerwood Ln N
- 9926 Deerwood Ln N
- 9946 Deerwood Ln N
- 11481 99th Place N
- 9916 Deerwood Ln N
- 11461 99th Place N
- 9937 Deerwood Ln N
- 11462 98th Place N
- 9927 Deerwood Ln N
- 9947 Deerwood Ln N
- 9906 Deerwood Ln N
- 9917 9917 Deerwood-Lane-n
- 9917 9917 Deerwood-Lane-
- 9917 Deerwood Ln N
- 11441 99th Place N
- 11492 99th Place N
- 11482 98th Place N
- 11502 99th Place N
- 11522 99th Place N
- 11542 99th Place N