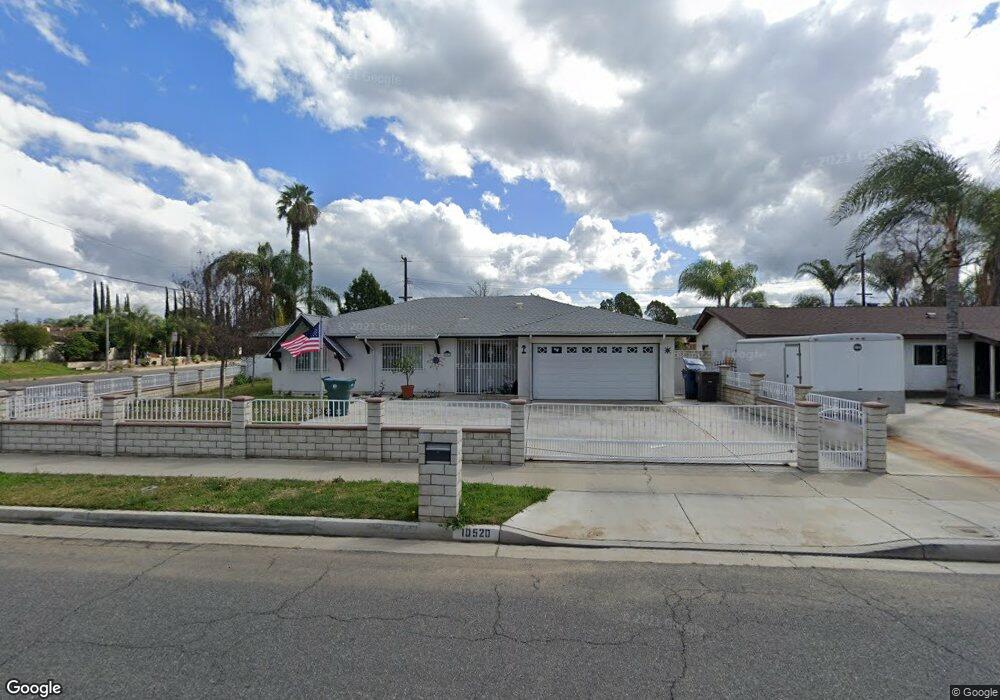
10520 Pendleton St Riverside, CA 92505
La Sierra NeighborhoodEstimated Value: $660,000 - $765,000
4
Beds
3
Baths
2,797
Sq Ft
$258/Sq Ft
Est. Value
About This Home
This home is located at 10520 Pendleton St, Riverside, CA 92505 and is currently estimated at $720,427, approximately $257 per square foot. 10520 Pendleton St is a home located in Riverside County with nearby schools including Collett Elementary School, Arizona Middle School, and La Sierra High School.
Ownership History
Date
Name
Owned For
Owner Type
Purchase Details
Closed on
May 16, 2019
Sold by
Goff Arthur Valencia
Bought by
Arthur Valencia Goff Revocable Trust
Current Estimated Value
Purchase Details
Closed on
Sep 19, 2017
Sold by
Goff Arthur and Goff Penelope
Bought by
Goff Arthur
Home Financials for this Owner
Home Financials are based on the most recent Mortgage that was taken out on this home.
Original Mortgage
$277,382
Outstanding Balance
$231,571
Interest Rate
3.89%
Mortgage Type
New Conventional
Estimated Equity
$488,856
Purchase Details
Closed on
Jun 27, 1995
Sold by
Allen Elmer Dyson and Allen Carolyn Anne
Bought by
Goff Arthur and Goff Penelope
Home Financials for this Owner
Home Financials are based on the most recent Mortgage that was taken out on this home.
Original Mortgage
$92,025
Interest Rate
7.61%
Mortgage Type
FHA
Create a Home Valuation Report for This Property
The Home Valuation Report is an in-depth analysis detailing your home's value as well as a comparison with similar homes in the area
Home Values in the Area
Average Home Value in this Area
Purchase History
| Date | Buyer | Sale Price | Title Company |
|---|---|---|---|
| Arthur Valencia Goff Revocable Trust | -- | None Available | |
| Goff Arthur | -- | Pacific Coast Title Company | |
| Goff Arthur | -- | Old Republic Title Company |
Source: Public Records
Mortgage History
| Date | Status | Borrower | Loan Amount |
|---|---|---|---|
| Open | Goff Arthur | $277,382 | |
| Closed | Goff Arthur | $92,025 |
Source: Public Records
Tax History
| Year | Tax Paid | Tax Assessment Tax Assessment Total Assessment is a certain percentage of the fair market value that is determined by local assessors to be the total taxable value of land and additions on the property. | Land | Improvement |
|---|---|---|---|---|
| 2025 | $4,342 | $367,082 | $66,426 | $300,656 |
| 2023 | $4,342 | $352,830 | $63,848 | $288,982 |
| 2022 | $4,015 | $345,913 | $62,597 | $283,316 |
| 2021 | $3,952 | $339,131 | $61,370 | $277,761 |
| 2020 | $3,888 | $335,654 | $60,741 | $274,913 |
| 2019 | $3,836 | $329,073 | $59,550 | $269,523 |
| 2018 | $3,781 | $322,622 | $58,383 | $264,239 |
| 2017 | $3,710 | $316,297 | $57,239 | $259,058 |
| 2016 | $3,647 | $310,096 | $56,117 | $253,979 |
| 2015 | $3,593 | $305,440 | $55,275 | $250,165 |
| 2014 | $3,580 | $299,459 | $54,194 | $245,265 |
Source: Public Records
Map
Nearby Homes
- 10649 Renner St
- 4314 Baggett Dr
- 0 Polk St
- 10233 Clara Vista Ln
- 10520 Cook Ave
- 10495 Cook Ave
- 4615 Mobley Ave
- 3549 Polk St
- 4389 Drexel Ave
- 4201 Ferguson Ct
- 3535 Banbury Dr Unit 88
- 3535 Banbury Dr Unit 14
- 4247 Bravado
- 3946 Tomlinson Ave
- 0 Cook Ave Unit PW25235031
- 11230 Reliance Dr
- 3665 Ross St
- 3625 Ross St
- 4834 Hedrick Ave
- 3666 Ada Ct
- 10534 Pendleton St
- 10517 Cochran Ave
- 10533 Cochran Ave
- 10568 Pendleton St
- 10541 Cochran Ave
- 10496 Pendleton St
- 10519 Pendleton St
- 10497 Pendleton St
- 10553 Cochran Ave
- 10582 Pendleton St
- 10495 Cochran Ave
- 10539 Pendleton St
- 10488 Pendleton St
- 10491 Pendleton St
- 10559 Pendleton St
- 10565 Cochran Ave
- 10598 Pendleton St
- 10518 Cochran Ave
- 10485 Cochran Ave
- 10490 Granger Ct
Your Personal Tour Guide
Ask me questions while you tour the home.