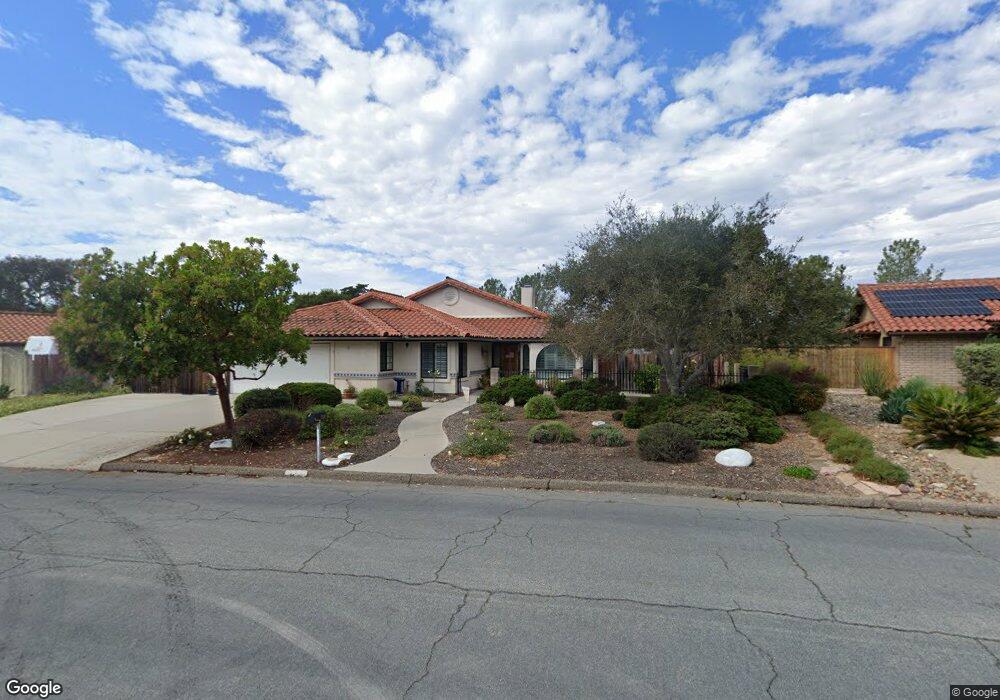
1091 Craig Dr Lompoc, CA 93436
Mission Hills NeighborhoodEstimated Value: $779,971 - $882,000
3
Beds
2
Baths
2,025
Sq Ft
$417/Sq Ft
Est. Value
About This Home
This home is located at 1091 Craig Dr, Lompoc, CA 93436 and is currently estimated at $843,493, approximately $416 per square foot. 1091 Craig Dr is a home located in Santa Barbara County with nearby schools including Los Berros Visual and Performing Arts Academy, Cabrillo High School, and Olive Grove Charter - Lompoc.
Ownership History
Date
Name
Owned For
Owner Type
Purchase Details
Closed on
Dec 4, 2020
Sold by
Kistler Karen L and Jacobsen Stephen From
Bought by
Kistler Karen L
Current Estimated Value
Home Financials for this Owner
Home Financials are based on the most recent Mortgage that was taken out on this home.
Original Mortgage
$381,000
Outstanding Balance
$276,276
Interest Rate
2.65%
Mortgage Type
New Conventional
Estimated Equity
$567,217
Purchase Details
Closed on
Mar 7, 2006
Sold by
Marchu Irena
Bought by
Niven William Thomas and Kistler Karen L
Home Financials for this Owner
Home Financials are based on the most recent Mortgage that was taken out on this home.
Original Mortgage
$57,500
Interest Rate
5.85%
Mortgage Type
Stand Alone Second
Create a Home Valuation Report for This Property
The Home Valuation Report is an in-depth analysis detailing your home's value as well as a comparison with similar homes in the area
Home Values in the Area
Average Home Value in this Area
Purchase History
| Date | Buyer | Sale Price | Title Company |
|---|---|---|---|
| Kistler Karen L | -- | Placer Title Company | |
| Niven William Thomas | $575,000 | Stewart Title Of Ca Inc |
Source: Public Records
Mortgage History
| Date | Status | Borrower | Loan Amount |
|---|---|---|---|
| Open | Kistler Karen L | $381,000 | |
| Closed | Niven William Thomas | $57,500 | |
| Closed | Niven William Thomas | $460,000 |
Source: Public Records
Tax History
| Year | Tax Paid | Tax Assessment Tax Assessment Total Assessment is a certain percentage of the fair market value that is determined by local assessors to be the total taxable value of land and additions on the property. | Land | Improvement |
|---|---|---|---|---|
| 2025 | $8,021 | $785,772 | $362,138 | $423,634 |
| 2023 | $8,021 | $669,000 | $311,000 | $358,000 |
| 2022 | $7,306 | $656,000 | $305,000 | $351,000 |
| 2021 | $6,542 | $570,000 | $265,000 | $305,000 |
| 2020 | $5,668 | $495,000 | $230,000 | $265,000 |
| 2019 | $5,572 | $485,000 | $225,000 | $260,000 |
| 2018 | $5,480 | $475,000 | $220,000 | $255,000 |
| 2017 | $5,219 | $452,000 | $209,000 | $243,000 |
| 2016 | $4,747 | $411,000 | $190,000 | $221,000 |
| 2014 | $4,347 | $372,000 | $172,000 | $200,000 |
Source: Public Records
Map
Nearby Homes
- 972 Pellham Dr
- 892 Onstott Rd
- 832 Onstott Rd
- 757 Onstott Rd
- 778 Tamarisk Dr
- 2655 Adobe Falls Rd
- 1588 Calle Portos
- 3578 Via Lato
- 3770 Rucker Rd
- 3838 Via Mitad
- 549 Palomar Cir
- 3725 Jupiter Ave
- 372 Falcon Crest Dr
- 384 Falcon Crest Dr
- 3825 Saturn Ave Unit 1
- 250 Saint Andrews Way
- 731 Voyager Rd
- 3843 Cassini Cir Unit 3
- 728 Pluto Ave
- 666 Carina Dr
Your Personal Tour Guide
Ask me questions while you tour the home.