
Seller's Agent in 2025
Bobby Chatih
Coldwell Banker Realty
(818) 518-4238
1 in this area
95 Total Sales
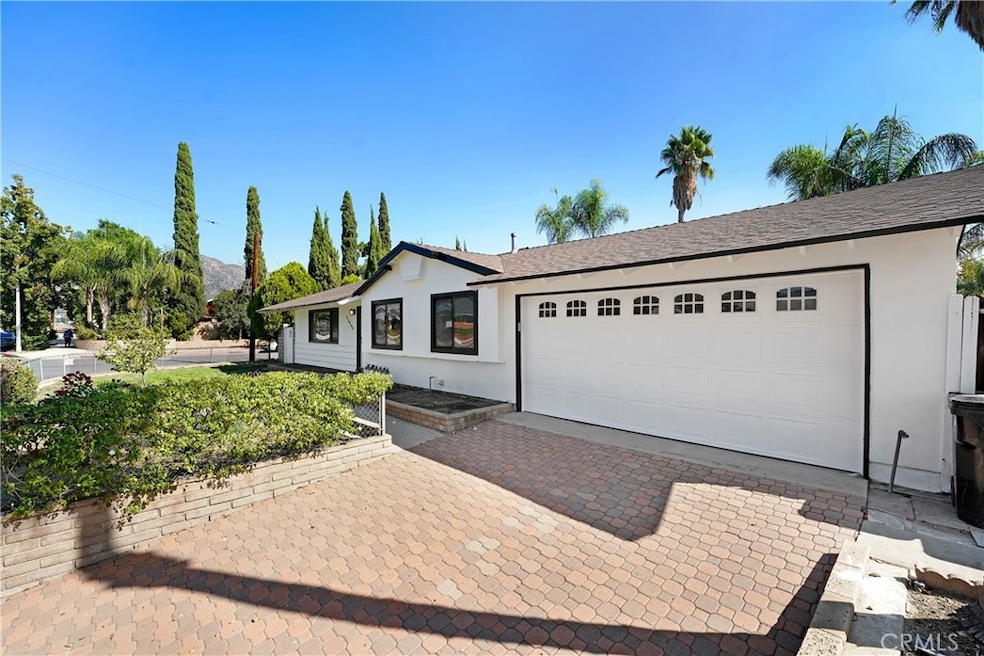
Welcome to 12940 Harding Street, Sylmar, CA 91342. Nestled in the peaceful foothills of Sylmar, this beautifully updated 3-bedroom, 2-bath home offers 1,164 sq ft of living space on a generous 8,323 sq ft corner lot. Located in a quiet neighborhood near newer homes, you’ll enjoy the perfect balance of tranquility and convenience—just moments from Los Angeles Mission College, El Cariso Golf Course, SIBL Baseball Complex, the community pool, Harding Elementary School, and local parks and hiking trails. Easy access to the 210, 5, and 118 freeways makes commuting a breeze.
Step inside to find a bright and inviting floor plan featuring fresh interior and exterior paint, remodeled bathrooms, and a thoughtful layout designed for comfort and functionality. The oversized two-car garage is a true highlight—offering extra space that could potentially be converted into a large ADU. The garage also features a rear roll-up door for vehicle or event access, a Tesla charger, and a built-in counter with sink, making it perfect for projects, hobbies, or entertaining. The expansive backyard offers endless possibilities—with ample space to host gatherings, garden, or even build an additional ADU in the back alongside the garage (buyer to verify). The outdoor area is framed by towering palm trees and mature grapevines with built-in support structures, creating a serene and inviting atmosphere. Whether you’re looking to live, expand, or invest, this Sylmar gem offers it all—updated interiors, flexible space, and huge potential in a fantastic neighborhood. Come see it today and imagine the possibilities.
Last Agent to Sell the Property
Coldwell Banker Realty Brokerage Phone: 818-518-4238 License #01899382 Listed on: 10/23/2025
| Date | Type | Sale Price | Title Company |
|---|---|---|---|
| Grant Deed | $815,000 | Orange Coast Title Company | |
| Interfamily Deed Transfer | -- | First American Title Company | |
| Interfamily Deed Transfer | -- | None Available | |
| Deed | -- | None Available | |
| Interfamily Deed Transfer | -- | -- |
| Date | Status | Loan Amount | Loan Type |
|---|---|---|---|
| Open | $787,799 | FHA | |
| Previous Owner | $288,750 | New Conventional |
| Date | Event | Price | List to Sale | Price per Sq Ft |
|---|---|---|---|---|
| 12/24/2025 12/24/25 | Sold | $815,000 | -1.2% | $700 / Sq Ft |
| 11/29/2025 11/29/25 | Pending | -- | -- | -- |
| 10/23/2025 10/23/25 | For Sale | $825,000 | -- | $709 / Sq Ft |
| Year | Tax Paid | Tax Assessment Tax Assessment Total Assessment is a certain percentage of the fair market value that is determined by local assessors to be the total taxable value of land and additions on the property. | Land | Improvement |
|---|---|---|---|---|
| 2025 | $4,702 | $368,965 | $189,607 | $179,358 |
| 2024 | $4,702 | $361,732 | $185,890 | $175,842 |
| 2023 | $4,616 | $354,641 | $182,246 | $172,395 |
| 2022 | $4,410 | $347,688 | $178,673 | $169,015 |
| 2021 | $4,354 | $340,871 | $175,170 | $165,701 |
| 2019 | $4,230 | $330,762 | $169,975 | $160,787 |
| 2018 | $4,129 | $324,278 | $166,643 | $157,635 |
| 2016 | $3,944 | $311,688 | $160,173 | $151,515 |
| 2015 | $3,889 | $307,008 | $157,768 | $149,240 |
| 2014 | $3,910 | $300,995 | $154,678 | $146,317 |
Seller's Agent in 2025
Bobby Chatih
Coldwell Banker Realty
(818) 518-4238
1 in this area
95 Total Sales
A
Buyer's Agent in 2025
Anahit Petrosyan
HK Realty
(818) 241-2244
1 in this area
18 Total Sales
Source: California Regional Multiple Listing Service (CRMLS)
MLS Number: SR25245463
APN: 2525-008-031
Disclaimer: Certain information contained herein is derived from information provided by parties other than Homes.com. All information provided is deemed reliable, but is not guaranteed to be accurate and should be independently verified.
![]() The multiple listing data appearing on this website, or contained in reports produced therefrom, is owned and copyrighted by California Regional Multiple Listing Service, Inc. ("CRMLS") and is protected by all applicable copyright laws. Information provided is for viewer's personal, non-commercial use and may not be used for any purpose other than to identify prospective properties the viewer may be interested in purchasing. All listing data, including but not limited to square footage and lot size is believed to be accurate, but the listing Agent, listing Broker and CRMLS and its affiliates do not warrant or guarantee such accuracy. The viewer should independently verify the listed data prior to making any decisions based on such information by personal inspection and/or contacting a real estate professional.
The multiple listing data appearing on this website, or contained in reports produced therefrom, is owned and copyrighted by California Regional Multiple Listing Service, Inc. ("CRMLS") and is protected by all applicable copyright laws. Information provided is for viewer's personal, non-commercial use and may not be used for any purpose other than to identify prospective properties the viewer may be interested in purchasing. All listing data, including but not limited to square footage and lot size is believed to be accurate, but the listing Agent, listing Broker and CRMLS and its affiliates do not warrant or guarantee such accuracy. The viewer should independently verify the listed data prior to making any decisions based on such information by personal inspection and/or contacting a real estate professional.
Based on information from California Regional Multiple Listing Service, Inc. and /or other sources. All data, including all measurements and calculations of area, is obtained from various sources and has not been, and will not be, verified by broker or MLS. All information should be independently reviewed and verified for accuracy. Properties may or may not be listed by the office/agent presenting the information
Ask me questions while you tour the home.