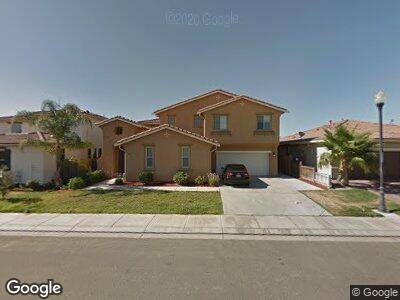
2021 Chadala Ct Atwater, CA 95301
Estimated Value: $560,366 - $639,000
6
Beds
3
Baths
3,492
Sq Ft
$175/Sq Ft
Est. Value
About This Home
This home is located at 2021 Chadala Ct, Atwater, CA 95301 and is currently estimated at $611,592, approximately $175 per square foot. 2021 Chadala Ct is a home located in Merced County with nearby schools including Shaffer Elementary School, Mitchell Intermediate School, and Buhach Colony High School.
Ownership History
Date
Name
Owned For
Owner Type
Purchase Details
Closed on
Sep 17, 2014
Sold by
Sarvepalli Suresh and Sarvepalli Sumathy
Bought by
Saevepalli & Sumathy Sarvepall Trust
Current Estimated Value
Purchase Details
Closed on
Jun 17, 2013
Sold by
Sarvepalli Suresh
Bought by
Sarvepalli Suresh and Sarvepalli Sumathy
Home Financials for this Owner
Home Financials are based on the most recent Mortgage that was taken out on this home.
Original Mortgage
$103,300
Outstanding Balance
$27,157
Interest Rate
3.48%
Mortgage Type
New Conventional
Estimated Equity
$567,570
Purchase Details
Closed on
Oct 9, 2008
Sold by
Hernandez Esteban and Hernandez Leticia
Bought by
Federal National Mortgage Association
Purchase Details
Closed on
Jul 27, 2006
Sold by
Mello Ranch 130 Llc
Bought by
Hernandez Esteban and Hernandez Leticia
Home Financials for this Owner
Home Financials are based on the most recent Mortgage that was taken out on this home.
Original Mortgage
$405,419
Interest Rate
6.62%
Mortgage Type
New Conventional
Create a Home Valuation Report for This Property
The Home Valuation Report is an in-depth analysis detailing your home's value as well as a comparison with similar homes in the area
Home Values in the Area
Average Home Value in this Area
Purchase History
| Date | Buyer | Sale Price | Title Company |
|---|---|---|---|
| Saevepalli & Sumathy Sarvepall Trust | -- | None Available | |
| Sarvepalli Suresh | -- | Orange Coast Title Company | |
| Federal National Mortgage Association | $430,400 | Fatco | |
| Hernandez Esteban | $507,000 | Transcounty Title Company |
Source: Public Records
Mortgage History
| Date | Status | Borrower | Loan Amount |
|---|---|---|---|
| Open | Sarvepalli Suresh | $103,300 | |
| Previous Owner | Hernandez Esteban | $405,419 |
Source: Public Records
Tax History Compared to Growth
Tax History
| Year | Tax Paid | Tax Assessment Tax Assessment Total Assessment is a certain percentage of the fair market value that is determined by local assessors to be the total taxable value of land and additions on the property. | Land | Improvement |
|---|---|---|---|---|
| 2024 | $4,035 | $277,736 | $25,242 | $252,494 |
| 2023 | $3,954 | $272,292 | $24,748 | $247,544 |
| 2022 | $3,851 | $266,954 | $24,263 | $242,691 |
| 2021 | $3,853 | $261,721 | $23,788 | $237,933 |
| 2020 | $3,865 | $259,039 | $23,545 | $235,494 |
| 2019 | $3,554 | $253,961 | $23,084 | $230,877 |
| 2018 | $3,472 | $248,982 | $22,632 | $226,350 |
| 2017 | $3,415 | $244,101 | $22,189 | $221,912 |
| 2016 | $3,410 | $239,315 | $21,754 | $217,561 |
| 2015 | $3,450 | $235,722 | $21,428 | $214,294 |
| 2014 | $3,389 | $231,106 | $21,009 | $210,097 |
Source: Public Records
Map
Nearby Homes
- 1821 Santa Ynez Ct
- 1840 De la Guerra Way
- 1 N A
- 1959 Cordelia Dr
- 1824 Augusta Ln
- 1939 Faxon Dr
- 1939 Bridlewood Dr
- 1300 Fairway Dr
- 1881 Valley St
- 713 Vista Del Rey Dr
- 5022 E Broadway Ave Unit 6
- 1052 Fairway Dr
- 76 Rancho Grande Cir
- 930 Travertine Way
- 98 Rancho Grande Cir
- 98 Rancho Grande Cir Unit 98
- 940 Rushmore Dr
- 42 Rancho Grande Cir Unit 42
- 42 Rancho Grande Cir
- 713 Snead Ct
- 2021 Chadala Ct
- 2017 Chadala Ct
- 2025 Chadala Ct
- 2020 De la Vina Ct
- 2013 Chadala Ct
- 2016 De la Vina Ct
- 2020 Chadala Ct
- 2012 De la Vina Ct
- 2024 Chadala Ct
- 2016 Chadala Ct
- 2009 Chadala Ct
- 2033 Anacada Ct
- 2012 Chadala Ct
- 2032 De la Guerra Way
- 2008 De la Vina Ct
- 2008 Chadala Ct
- 2032 Anacada Ct
- 2037 Anacada Ct
- 1811 Santa Ynez Ct
- 2021 Sola Ct