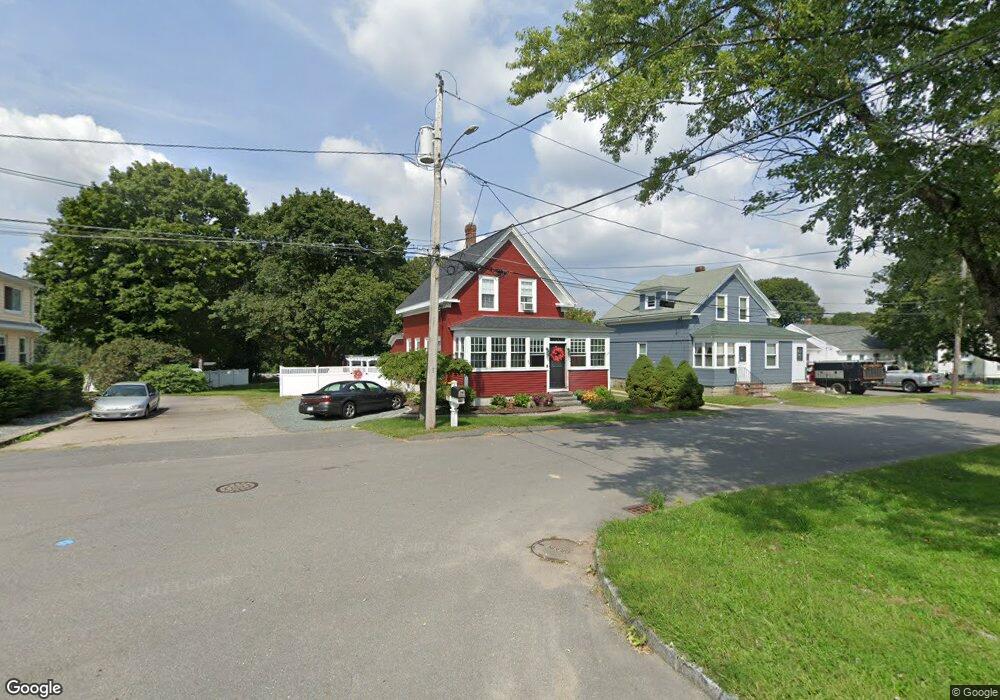
25 Metcalf St Franklin, MA 02038
Downtown Franklin NeighborhoodEstimated Value: $526,000 - $580,000
3
Beds
2
Baths
1,336
Sq Ft
$414/Sq Ft
Est. Value
About This Home
This home is located at 25 Metcalf St, Franklin, MA 02038 and is currently estimated at $553,071, approximately $413 per square foot. 25 Metcalf St is a home located in Norfolk County with nearby schools including Remington Middle School, Franklin High School, and Benjamin Franklin Classical Charter Public School.
Ownership History
Date
Name
Owned For
Owner Type
Purchase Details
Closed on
Oct 2, 2015
Sold by
Harris Michael N and Harris Amy M
Bought by
Harris Amy M and Lammi Karl
Current Estimated Value
Purchase Details
Closed on
May 28, 1999
Sold by
Harrison Robert M and Harrison Marcia L
Bought by
Harris Mcihael N and Harris Amy M
Home Financials for this Owner
Home Financials are based on the most recent Mortgage that was taken out on this home.
Original Mortgage
$144,875
Interest Rate
6.82%
Mortgage Type
Purchase Money Mortgage
Purchase Details
Closed on
Dec 19, 1991
Sold by
Vise David L and Vise Margaret M
Bought by
Harrison Robert M and Harrison Marcia L
Home Financials for this Owner
Home Financials are based on the most recent Mortgage that was taken out on this home.
Original Mortgage
$108,450
Interest Rate
8.68%
Mortgage Type
Purchase Money Mortgage
Create a Home Valuation Report for This Property
The Home Valuation Report is an in-depth analysis detailing your home's value as well as a comparison with similar homes in the area
Home Values in the Area
Average Home Value in this Area
Purchase History
| Date | Buyer | Sale Price | Title Company |
|---|---|---|---|
| Harris Amy M | -- | -- | |
| Harris Mcihael N | $152,500 | -- | |
| Harrison Robert M | $120,500 | -- |
Source: Public Records
Mortgage History
| Date | Status | Borrower | Loan Amount |
|---|---|---|---|
| Previous Owner | Harrison Robert M | $144,875 | |
| Previous Owner | Harrison Robert M | $105,300 | |
| Previous Owner | Harrison Robert M | $108,450 |
Source: Public Records
Tax History Compared to Growth
Tax History
| Year | Tax Paid | Tax Assessment Tax Assessment Total Assessment is a certain percentage of the fair market value that is determined by local assessors to be the total taxable value of land and additions on the property. | Land | Improvement |
|---|---|---|---|---|
| 2025 | $5,726 | $492,800 | $240,400 | $252,400 |
| 2024 | $5,160 | $437,700 | $240,400 | $197,300 |
| 2023 | $5,308 | $421,900 | $242,400 | $179,500 |
| 2022 | $5,016 | $357,000 | $200,300 | $156,700 |
| 2021 | $4,969 | $339,200 | $214,600 | $124,600 |
| 2020 | $4,852 | $334,400 | $216,400 | $118,000 |
| 2019 | $4,603 | $314,000 | $196,100 | $117,900 |
| 2018 | $4,486 | $306,200 | $201,600 | $104,600 |
| 2017 | $4,222 | $289,600 | $185,000 | $104,600 |
| 2016 | $3,961 | $273,200 | $181,900 | $91,300 |
| 2015 | $3,988 | $268,700 | $177,400 | $91,300 |
| 2014 | $3,454 | $239,000 | $149,100 | $89,900 |
Source: Public Records
Map
Nearby Homes
- 1 Joy St
- 417 Union St
- 374-378 Union St
- 1 Pond Place
- 7 Howard Place
- 246 Washington St
- 97 Fisher St
- 67 Cottage St
- 32 Dale St
- 99 Summer St
- 120 Union St Unit 1
- 90 E Central St Unit 103
- 90 E Central St Unit 106
- 90 E Central St Unit 304
- 90 E Central St Unit 202
- 90 E Central St Unit 105
- 90 E Central St Unit 301
- 6 Buena Vista Dr
- 40 Cross St
- 82 Uncas Ave Unit 1
- 21 Metcalf St
- 19 Metcalf St
- 33 Metcalf St
- 31 Landry St
- 45 A St
- 32 Landry St
- 21 Worsted St
- 59 A St
- 59 A St Unit 1
- 59 A St Unit 2
- 51 A St
- 17 Worsted St
- 25 Worsted St
- 25 Worsted St Unit 1
- 25 Worsted St Unit 2
- 25 Worsted St Unit A
- 27 Worsted St Unit 3A
- 27 Worsted St Unit 2A
- 27 Worsted St Unit 1B
- 27 Worsted St Unit 1A