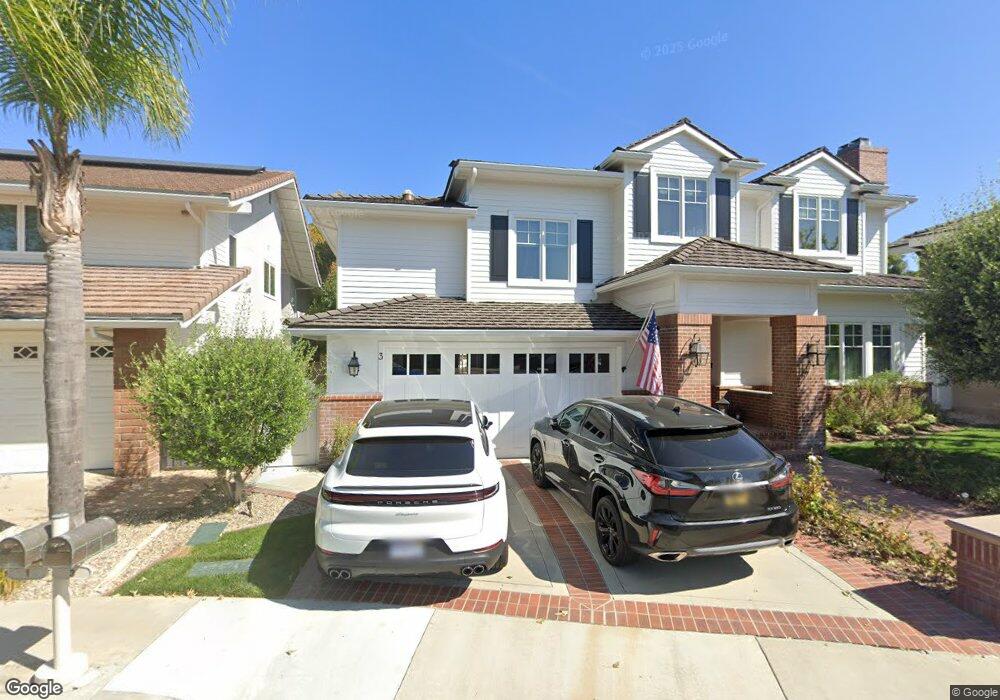
3 Bluff View Irvine, CA 92603
Turtle Rock NeighborhoodEstimated Value: $3,377,000 - $4,399,905
4
Beds
4
Baths
3,982
Sq Ft
$988/Sq Ft
Est. Value
About This Home
This home is located at 3 Bluff View, Irvine, CA 92603 and is currently estimated at $3,932,976, approximately $987 per square foot. 3 Bluff View is a home located in Orange County with nearby schools including Bonita Canyon Elementary, Rancho San Joaquin Middle School, and University High School.
Ownership History
Date
Name
Owned For
Owner Type
Purchase Details
Closed on
Sep 16, 2022
Sold by
Ellen Chiboucas
Bought by
Chiboucas James
Current Estimated Value
Purchase Details
Closed on
Nov 27, 1996
Sold by
Reitz Neal M and Reitz Kelly E
Bought by
Chiboucas James and Chiboucas Ellen
Home Financials for this Owner
Home Financials are based on the most recent Mortgage that was taken out on this home.
Original Mortgage
$426,400
Interest Rate
7.76%
Purchase Details
Closed on
Feb 22, 1994
Sold by
Reitz Neal M and Reitz Eileen L
Bought by
Reitz Neal M and Reitz Eileen L
Home Financials for this Owner
Home Financials are based on the most recent Mortgage that was taken out on this home.
Original Mortgage
$416,000
Interest Rate
3.95%
Create a Home Valuation Report for This Property
The Home Valuation Report is an in-depth analysis detailing your home's value as well as a comparison with similar homes in the area
Home Values in the Area
Average Home Value in this Area
Purchase History
| Date | Buyer | Sale Price | Title Company |
|---|---|---|---|
| Chiboucas James | -- | Accommodation/Courtesy Recordi | |
| Chiboucas James | $533,500 | Fidelity National Title Co | |
| Reitz Neal M | -- | Guardian Title Company | |
| Reitz Neal M | -- | Guardian Title Company |
Source: Public Records
Mortgage History
| Date | Status | Borrower | Loan Amount |
|---|---|---|---|
| Previous Owner | Chiboucas James | $426,400 | |
| Previous Owner | Reitz Neal M | $416,000 |
Source: Public Records
Tax History
| Year | Tax Paid | Tax Assessment Tax Assessment Total Assessment is a certain percentage of the fair market value that is determined by local assessors to be the total taxable value of land and additions on the property. | Land | Improvement |
|---|---|---|---|---|
| 2025 | $11,878 | $1,139,876 | $620,092 | $519,784 |
| 2024 | $11,878 | $1,117,526 | $607,933 | $509,593 |
| 2023 | $11,571 | $1,095,614 | $596,013 | $499,601 |
| 2022 | $11,354 | $1,074,132 | $584,327 | $489,805 |
| 2021 | $11,097 | $1,053,071 | $572,870 | $480,201 |
| 2020 | $11,034 | $1,042,274 | $566,996 | $475,278 |
| 2019 | $10,789 | $1,021,838 | $555,879 | $465,959 |
| 2018 | $10,599 | $1,001,802 | $544,979 | $456,823 |
| 2017 | $10,381 | $982,159 | $534,293 | $447,866 |
| 2016 | $9,919 | $962,901 | $523,816 | $439,085 |
| 2015 | $9,770 | $948,438 | $515,948 | $432,490 |
| 2014 | $9,579 | $929,860 | $505,841 | $424,019 |
Source: Public Records
Map
Nearby Homes
- 6286 Sierra Siena Rd
- 7 Sunpeak
- 57 Sweet Bay
- 53 Sweet Bay
- 3 Candlebush
- 10 Starfall Unit 11
- 42 Arcade
- 7 Sunup
- 8 Evening Breeze
- 40 Canyon Ridge
- 46 Woods Trail
- 21 Sylvan
- 28 Brigmore Aisle Unit 4
- 12 Sunstream
- 18862 Via Palatino
- 19421 Sierra Lago Rd
- 20 Blue Summit
- 19 Rippling Stream
- 18751 Via San Marco
- 25 Golden Eagle
Your Personal Tour Guide
Ask me questions while you tour the home.