34 Shade Tree Unit 35 Irvine, CA 92603
Turtle Ridge NeighborhoodEstimated Value: $2,072,193 - $2,498,000
2
Beds
2
Baths
2,032
Sq Ft
$1,118/Sq Ft
Est. Value
About This Home
This home is located at 34 Shade Tree Unit 35, Irvine, CA 92603 and is currently estimated at $2,271,731, approximately $1,117 per square foot. 34 Shade Tree Unit 35 is a home located in Orange County with nearby schools including Vista Verde, Rancho San Joaquin Middle School, and University High School.
Ownership History
Date
Name
Owned For
Owner Type
Purchase Details
Closed on
Jan 22, 2011
Sold by
Farsai Shahin
Bought by
Farsai Shahin and Farsai Family Trust
Current Estimated Value
Home Financials for this Owner
Home Financials are based on the most recent Mortgage that was taken out on this home.
Original Mortgage
$414,000
Outstanding Balance
$258,927
Interest Rate
3.12%
Mortgage Type
New Conventional
Estimated Equity
$2,012,804
Purchase Details
Closed on
Apr 19, 2005
Sold by
Farsai Nasrullah and Farsai Shahin
Bought by
Farsai Nasrullah and Farsai Shahin
Purchase Details
Closed on
Apr 10, 2003
Sold by
Standard Pacific Corp
Bought by
Farsai Nasrullah and Farsai Shahin
Home Financials for this Owner
Home Financials are based on the most recent Mortgage that was taken out on this home.
Original Mortgage
$410,000
Interest Rate
4.62%
Mortgage Type
Purchase Money Mortgage
Create a Home Valuation Report for This Property
The Home Valuation Report is an in-depth analysis detailing your home's value as well as a comparison with similar homes in the area
Home Values in the Area
Average Home Value in this Area
Purchase History
| Date | Buyer | Sale Price | Title Company |
|---|---|---|---|
| Farsai Shahin | -- | Equity Title Company | |
| Farsai Nasrullah | -- | -- | |
| Farsai Nasrullah | -- | -- | |
| Farsai Nasrullah | $653,500 | First American Title Co |
Source: Public Records
Mortgage History
| Date | Status | Borrower | Loan Amount |
|---|---|---|---|
| Open | Farsai Shahin | $414,000 | |
| Previous Owner | Farsai Nasrullah | $410,000 |
Source: Public Records
Tax History
| Year | Tax Paid | Tax Assessment Tax Assessment Total Assessment is a certain percentage of the fair market value that is determined by local assessors to be the total taxable value of land and additions on the property. | Land | Improvement |
|---|---|---|---|---|
| 2025 | $12,859 | $946,478 | $623,133 | $323,345 |
| 2024 | $12,859 | $927,920 | $610,915 | $317,005 |
| 2023 | $12,656 | $909,726 | $598,936 | $310,790 |
| 2022 | $12,430 | $891,889 | $587,192 | $304,697 |
| 2021 | $12,264 | $874,401 | $575,678 | $298,723 |
| 2020 | $12,159 | $865,436 | $569,776 | $295,660 |
| 2019 | $11,965 | $848,467 | $558,604 | $289,863 |
| 2018 | $11,773 | $831,831 | $547,651 | $284,180 |
| 2017 | $11,585 | $815,521 | $536,913 | $278,608 |
| 2016 | $11,392 | $799,531 | $526,385 | $273,146 |
| 2015 | $11,180 | $787,522 | $518,478 | $269,044 |
| 2014 | $11,290 | $772,096 | $508,322 | $263,774 |
Source: Public Records
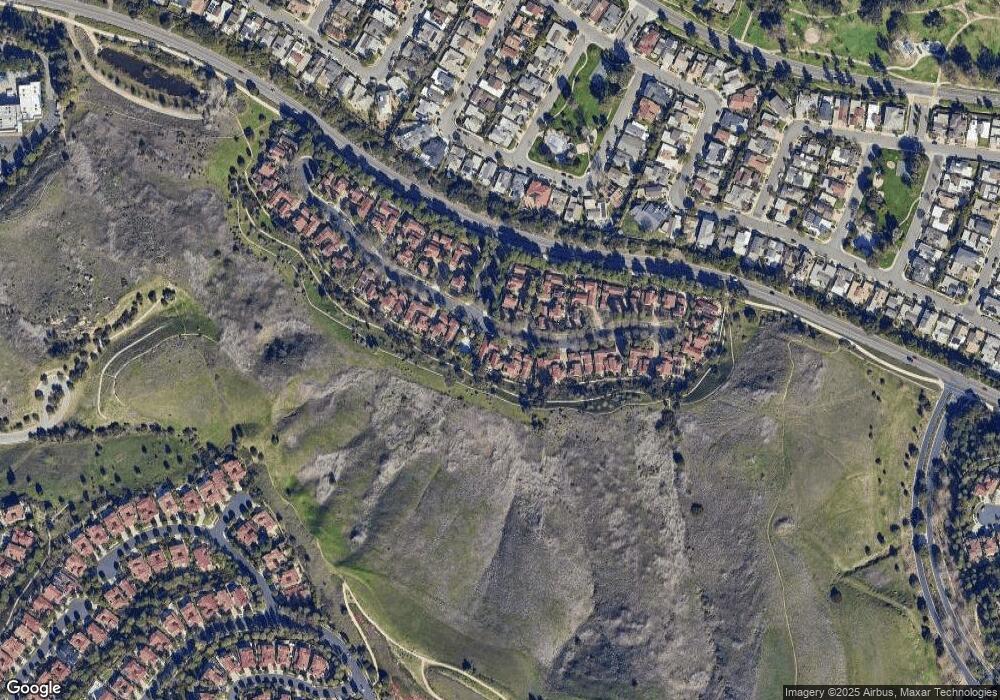
Map
Nearby Homes
- 5711 Sierra Cielo Rd
- 10 Bower Tree Unit 35
- 42 Arcade
- 22 Arborside Unit 11
- 79 Canyoncrest
- 6286 Sierra Siena Rd
- 21 Sylvan
- 57 Arborside
- 117 White Flower Unit 165
- 46 Woods Trail
- 213 Coral Rose
- 21 Ridgeview
- 20 Southern Wood
- 26 Windflower
- 7 Altair
- 40 Canyon Ridge
- 26 Canyon Ridge
- 18751 Via San Marco
- 10 Starfall Unit 11
- 22 Delphinus
- 32 Shade Tree
- 30 Shade Tree Unit 33
- 28 Shade Tree Unit 32
- 37 Shade Tree
- 39 Shade Tree
- 44 Shade Tree
- 46 Shade Tree
- 26 Shade Tree
- 25 Shade Tree
- 33 Shade Tree
- 35 Shade Tree
- 24 Shade Tree Unit 30
- 41 Shade Tree
- 48 Shade Tree Unit 38
- 27 Shade Tree Unit 7
- 50 Shade Tree
- 43 Shade Tree
- 31 Shade Tree Unit 5
- 22 Shade Tree Unit 29
- 29 Shade Tree