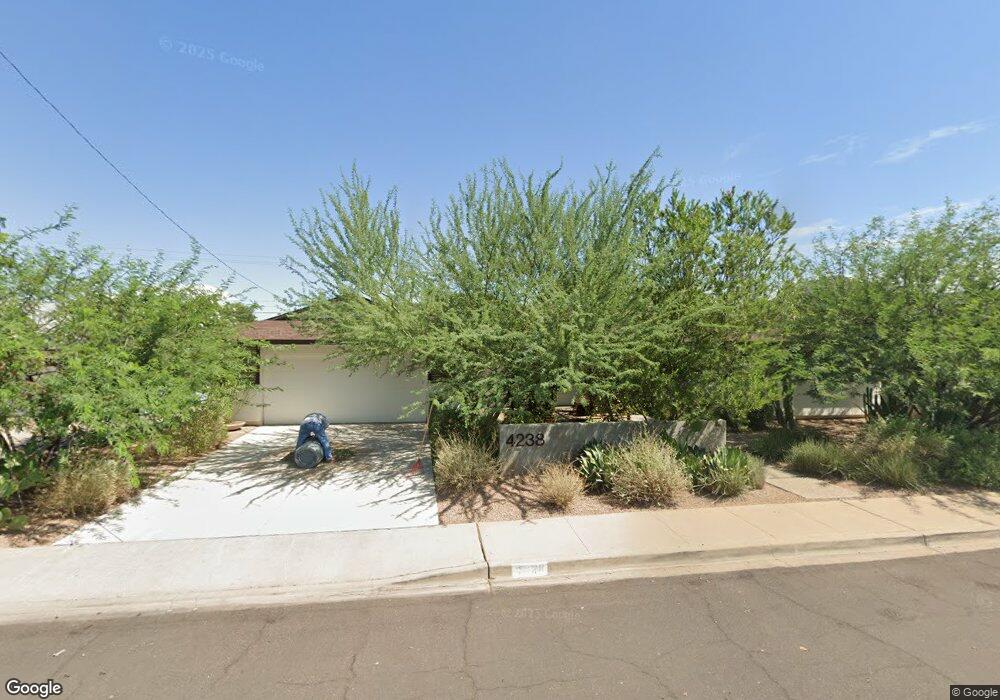
4238 E Weldon Ave Phoenix, AZ 85018
Camelback East Village NeighborhoodEstimated Value: $1,160,264 - $1,328,000
3
Beds
2
Baths
1,689
Sq Ft
$729/Sq Ft
Est. Value
About This Home
This home is located at 4238 E Weldon Ave, Phoenix, AZ 85018 and is currently estimated at $1,230,816, approximately $728 per square foot. 4238 E Weldon Ave is a home located in Maricopa County with nearby schools including Tavan Elementary School, Ingleside Middle School, and Arcadia High School.
Ownership History
Date
Name
Owned For
Owner Type
Purchase Details
Closed on
Sep 6, 2023
Sold by
Baker Karen L
Bought by
Karen L Baker Trust and Baker
Current Estimated Value
Purchase Details
Closed on
Aug 21, 2003
Sold by
Berg Scott M and Berg Patricia H
Bought by
Baker Karen L
Purchase Details
Closed on
Nov 3, 1998
Sold by
Rohter Roy V and Rohter Denise R
Bought by
Berg Scott M and Berg Patricia H
Home Financials for this Owner
Home Financials are based on the most recent Mortgage that was taken out on this home.
Original Mortgage
$160,000
Interest Rate
6.42%
Purchase Details
Closed on
Jun 26, 1998
Sold by
Pullen Randall L
Bought by
Rohter Roy and Rohter Denise R
Purchase Details
Closed on
Sep 13, 1994
Sold by
Randolph Gregg
Bought by
Pullen Randall L
Home Financials for this Owner
Home Financials are based on the most recent Mortgage that was taken out on this home.
Original Mortgage
$10
Interest Rate
8.5%
Mortgage Type
Assumption
Create a Home Valuation Report for This Property
The Home Valuation Report is an in-depth analysis detailing your home's value as well as a comparison with similar homes in the area
Home Values in the Area
Average Home Value in this Area
Purchase History
| Date | Buyer | Sale Price | Title Company |
|---|---|---|---|
| Karen L Baker Trust | -- | None Listed On Document | |
| Baker Karen L | $235,000 | North American Title Co | |
| Berg Scott M | $160,000 | Fidelity Title | |
| Rohter Roy | $143,000 | Stewart Title & Trust | |
| Pullen Randall L | $124,200 | Stewart Title & Trust |
Source: Public Records
Mortgage History
| Date | Status | Borrower | Loan Amount |
|---|---|---|---|
| Previous Owner | Berg Scott M | $160,000 | |
| Previous Owner | Pullen Randall L | $10 |
Source: Public Records
Tax History
| Year | Tax Paid | Tax Assessment Tax Assessment Total Assessment is a certain percentage of the fair market value that is determined by local assessors to be the total taxable value of land and additions on the property. | Land | Improvement |
|---|---|---|---|---|
| 2025 | $3,475 | $47,745 | -- | -- |
| 2024 | $3,227 | $45,471 | -- | -- |
| 2023 | $3,227 | $71,120 | $14,220 | $56,900 |
| 2022 | $3,112 | $57,210 | $11,440 | $45,770 |
| 2021 | $3,267 | $53,400 | $10,680 | $42,720 |
| 2020 | $3,216 | $51,410 | $10,280 | $41,130 |
| 2019 | $3,110 | $46,070 | $9,210 | $36,860 |
| 2018 | $3,010 | $42,930 | $8,580 | $34,350 |
| 2017 | $2,845 | $42,520 | $8,500 | $34,020 |
| 2016 | $1,834 | $29,530 | $5,900 | $23,630 |
| 2015 | $1,687 | $28,650 | $5,730 | $22,920 |
Source: Public Records
Map
Nearby Homes
- 4323 E Whitton Ave
- 4330 E Mitchell Dr Unit 53
- 3416 N 44th St Unit 8
- 3416 N 44th St Unit 62
- 3416 N 44th St Unit 69
- 3334 N 42nd St
- 4343 E Osborn Rd Unit 2
- 4434 E Mitchell Dr
- 4013 E Indianola Ave
- 4001 E Indianola Ave
- 4020 N 44th Place
- 3313 N 43rd Place
- 4036 N 40th Place
- 3413 N 45th St
- 4005 E Osborn Rd
- 4145 N 42nd Place
- 3901 E Weldon Ave
- 4120 N 44th Place
- 3139 N 40th St
- 3906 E Crittenden Ln
- 4244 E Weldon Ave
- 4230 E Weldon Ave
- 4231 E Clarendon Ave
- 4241 E Clarendon Ave
- 4237 E Weldon Ave
- 4231 E Weldon Ave
- 4302 E Weldon Ave
- 4224 E Weldon Ave
- 4301 E Weldon Ave
- 4223 E Weldon Ave
- 4301 E Clarendon Ave
- 4218 E Weldon Ave
- 4215 E Clarendon Ave
- 4232 E Whitton Ave
- 4309 E Weldon Ave
- 4238 E Whitton Ave
- 4215 E Weldon Ave
- 4230 E Clarendon Ave
- 4240 E Clarendon Ave
- 4224 E Whitton Ave
Your Personal Tour Guide
Ask me questions while you tour the home.