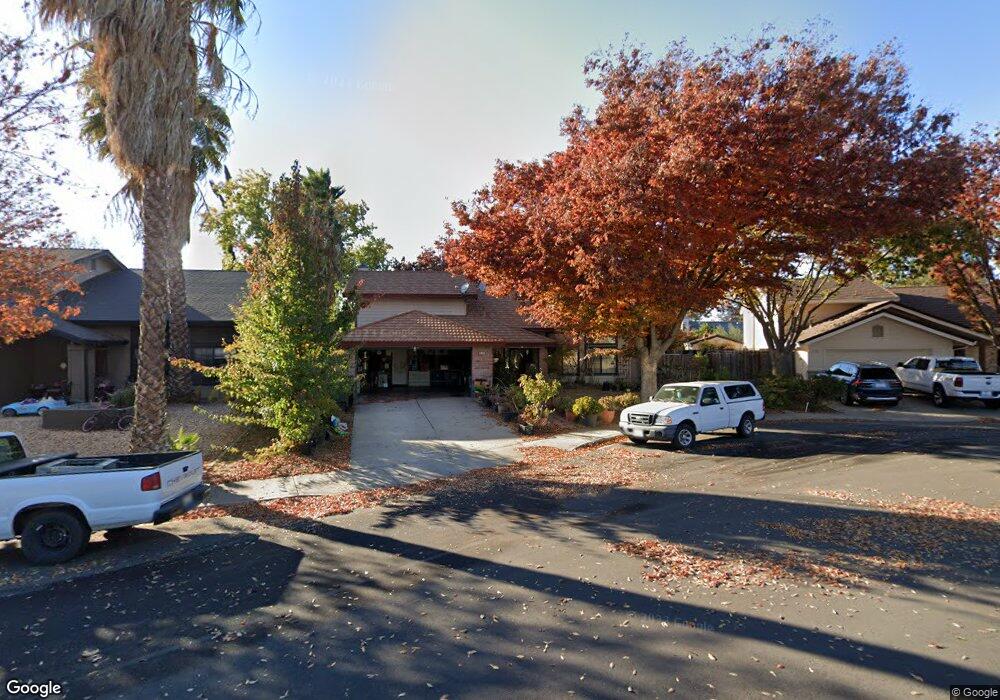
523 Klopping Ct Patterson, CA 95363
Estimated Value: $501,000 - $511,156
4
Beds
3
Baths
2,245
Sq Ft
$226/Sq Ft
Est. Value
About This Home
This home is located at 523 Klopping Ct, Patterson, CA 95363 and is currently estimated at $507,039, approximately $225 per square foot. 523 Klopping Ct is a home located in Stanislaus County with nearby schools including Las Palmas Elementary School, Creekside Middle School, and Patterson High School.
Ownership History
Date
Name
Owned For
Owner Type
Purchase Details
Closed on
May 15, 2003
Sold by
Sundiang Antonio P
Bought by
Sundiang Antonio P and Sundiang Erlinda D
Current Estimated Value
Home Financials for this Owner
Home Financials are based on the most recent Mortgage that was taken out on this home.
Original Mortgage
$258,400
Outstanding Balance
$111,170
Interest Rate
5.77%
Mortgage Type
Purchase Money Mortgage
Estimated Equity
$395,869
Purchase Details
Closed on
May 9, 2003
Sold by
Myers Michael R
Bought by
Sundiang Erlinda D
Home Financials for this Owner
Home Financials are based on the most recent Mortgage that was taken out on this home.
Original Mortgage
$258,400
Outstanding Balance
$111,170
Interest Rate
5.77%
Mortgage Type
Purchase Money Mortgage
Estimated Equity
$395,869
Purchase Details
Closed on
Dec 26, 1996
Sold by
Flory Kevin J and Flory Rachel K
Bought by
Myers Michael Ray and Myers Amanda Sanford
Home Financials for this Owner
Home Financials are based on the most recent Mortgage that was taken out on this home.
Original Mortgage
$133,550
Interest Rate
7.53%
Mortgage Type
FHA
Create a Home Valuation Report for This Property
The Home Valuation Report is an in-depth analysis detailing your home's value as well as a comparison with similar homes in the area
Home Values in the Area
Average Home Value in this Area
Purchase History
| Date | Buyer | Sale Price | Title Company |
|---|---|---|---|
| Sundiang Antonio P | -- | Chicago Title Company | |
| Sundiang Erlinda D | -- | Chicago Title | |
| Sundiang Erlinda D | $272,000 | Chicago Title | |
| Myers Michael Ray | $135,000 | Chicago Title Co |
Source: Public Records
Mortgage History
| Date | Status | Borrower | Loan Amount |
|---|---|---|---|
| Open | Sundiang Erlinda D | $258,400 | |
| Previous Owner | Myers Michael Ray | $133,550 |
Source: Public Records
Tax History
| Year | Tax Paid | Tax Assessment Tax Assessment Total Assessment is a certain percentage of the fair market value that is determined by local assessors to be the total taxable value of land and additions on the property. | Land | Improvement |
|---|---|---|---|---|
| 2025 | $4,563 | $393,925 | $115,855 | $278,070 |
| 2024 | $4,548 | $386,202 | $113,584 | $272,618 |
| 2023 | $4,441 | $378,630 | $111,357 | $267,273 |
| 2022 | $4,193 | $371,207 | $109,174 | $262,033 |
| 2021 | $4,158 | $363,930 | $107,034 | $256,896 |
| 2020 | $4,135 | $360,199 | $105,937 | $254,262 |
| 2019 | $4,070 | $353,137 | $103,860 | $249,277 |
| 2018 | $3,874 | $346,214 | $101,824 | $244,390 |
| 2017 | $3,319 | $296,500 | $100,000 | $196,500 |
| 2016 | $3,194 | $287,500 | $70,000 | $217,500 |
| 2015 | $3,015 | $271,000 | $35,000 | $236,000 |
| 2014 | $2,594 | $233,500 | $30,000 | $203,500 |
Source: Public Records
Map
Nearby Homes
- 708 Bonneau Ct
- 850 Miraggio Dr
- 15707 S 9th St
- 855 Toyon Ln
- 1008 Summer Ln
- 191 Fall Ave
- 1117 Van Gogh Ln
- 357 Wolfpack Ct
- 1127 Kestrel Dr
- 1132 Marsh Wren Ct
- 1242 Yellowhammer Dr
- 409 Osprey Dr
- 433 Sanderling Dr
- 403 Elfers Rd
- 425 Elfers Rd
- 647 Ward Ave
- 642 Wanzia Ct
- 1314 Sutter Creek Ct
- 432 Meadow Creek Dr
- 1413 Angus St
- 527 Klopping Ct
- 519 Klopping Ct
- 524 Clover Ave
- 520 Clover Ave
- 528 Clover Ave
- 531 Klopping Ct
- 516 Clover Ave
- 516 Klopping Ct
- 532 Clover Ave
- 524 Klopping Ct
- 535 Klopping Ct
- 528 Klopping Ct
- 712 Bonneau Ct
- 520 Klopping Ct
- 512 Clover Ave
- 532 Klopping Ct
- 536 Clover Ave
- 714 Bonneau Ct
- 539 Klopping Ct
- 525 Clover Ave
Your Personal Tour Guide
Ask me questions while you tour the home.