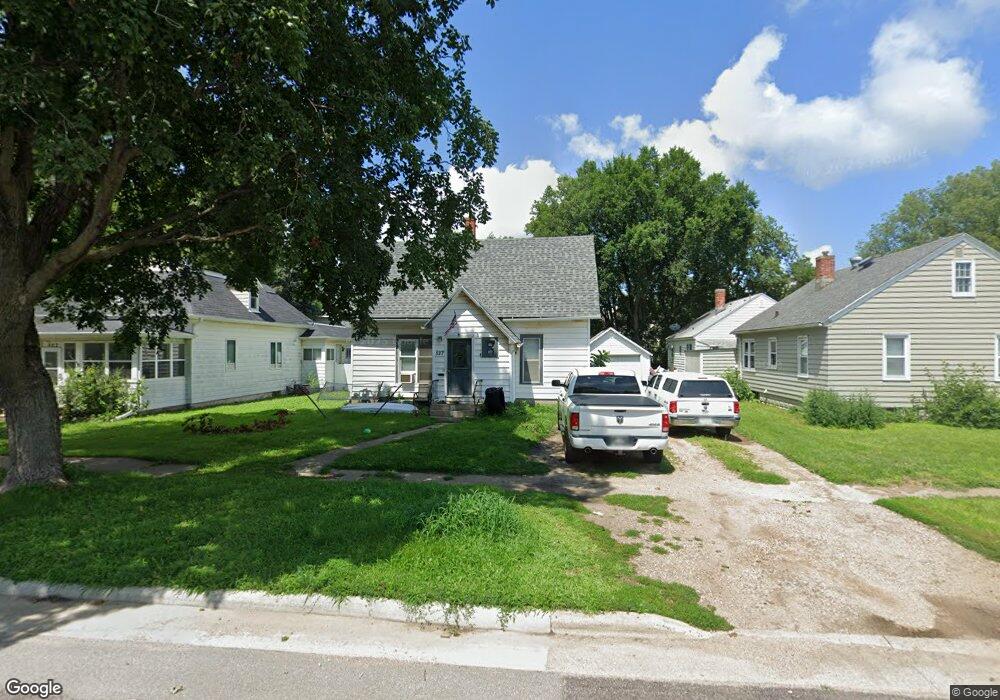
527 E 3rd St Spencer, IA 51301
Estimated Value: $105,966 - $134,000
3
Beds
2
Baths
1,527
Sq Ft
$79/Sq Ft
Est. Value
About This Home
This home is located at 527 E 3rd St, Spencer, IA 51301 and is currently estimated at $120,492, approximately $78 per square foot. 527 E 3rd St is a home located in Clay County with nearby schools including Johnson Elementary School, Fairview Park Elementary School, and Lincoln Elementary School.
Ownership History
Date
Name
Owned For
Owner Type
Purchase Details
Closed on
Feb 13, 2014
Sold by
Fannie Mae
Bought by
Carpenter Christopher and Carpenter Terrance
Current Estimated Value
Home Financials for this Owner
Home Financials are based on the most recent Mortgage that was taken out on this home.
Original Mortgage
$27,000
Outstanding Balance
$20,560
Interest Rate
4.54%
Mortgage Type
Future Advance Clause Open End Mortgage
Estimated Equity
$99,932
Purchase Details
Closed on
Sep 9, 2013
Sold by
State Farm Bank Fsb
Bought by
Federal National Mortgage Association
Create a Home Valuation Report for This Property
The Home Valuation Report is an in-depth analysis detailing your home's value as well as a comparison with similar homes in the area
Home Values in the Area
Average Home Value in this Area
Purchase History
| Date | Buyer | Sale Price | Title Company |
|---|---|---|---|
| Carpenter Christopher | $28,000 | Servicelink | |
| Federal National Mortgage Association | -- | None Available |
Source: Public Records
Mortgage History
| Date | Status | Borrower | Loan Amount |
|---|---|---|---|
| Open | Carpenter Christopher | $27,000 |
Source: Public Records
Tax History
| Year | Tax Paid | Tax Assessment Tax Assessment Total Assessment is a certain percentage of the fair market value that is determined by local assessors to be the total taxable value of land and additions on the property. | Land | Improvement |
|---|---|---|---|---|
| 2025 | $1,480 | $100,520 | $16,630 | $83,890 |
| 2024 | $1,480 | $92,420 | $12,830 | $79,590 |
| 2023 | $1,430 | $92,420 | $12,830 | $79,590 |
| 2022 | $1,322 | $78,490 | $12,830 | $65,660 |
| 2021 | $1,284 | $73,970 | $12,830 | $61,140 |
| 2020 | $1,284 | $68,220 | $10,930 | $57,290 |
| 2019 | $1,152 | $62,820 | $0 | $0 |
| 2018 | $1,134 | $62,820 | $0 | $0 |
| 2017 | $1,134 | $58,960 | $0 | $0 |
| 2016 | $1,106 | $58,960 | $0 | $0 |
| 2015 | $1,112 | $59,330 | $0 | $0 |
| 2014 | $1,080 | $59,330 | $0 | $0 |
Source: Public Records
Map
Nearby Homes
Your Personal Tour Guide
Ask me questions while you tour the home.