

5467 Pinewood Rd Franklin, TN 37064
Leiper's Fork NeighborhoodEstimated payment $12,053/month
Highlights
- Very Popular Property
- 5.04 Acre Lot
- Wood Flooring
- Hillsboro Elementary/Middle School Rated A
- Deck
- Separate Formal Living Room
About This Home
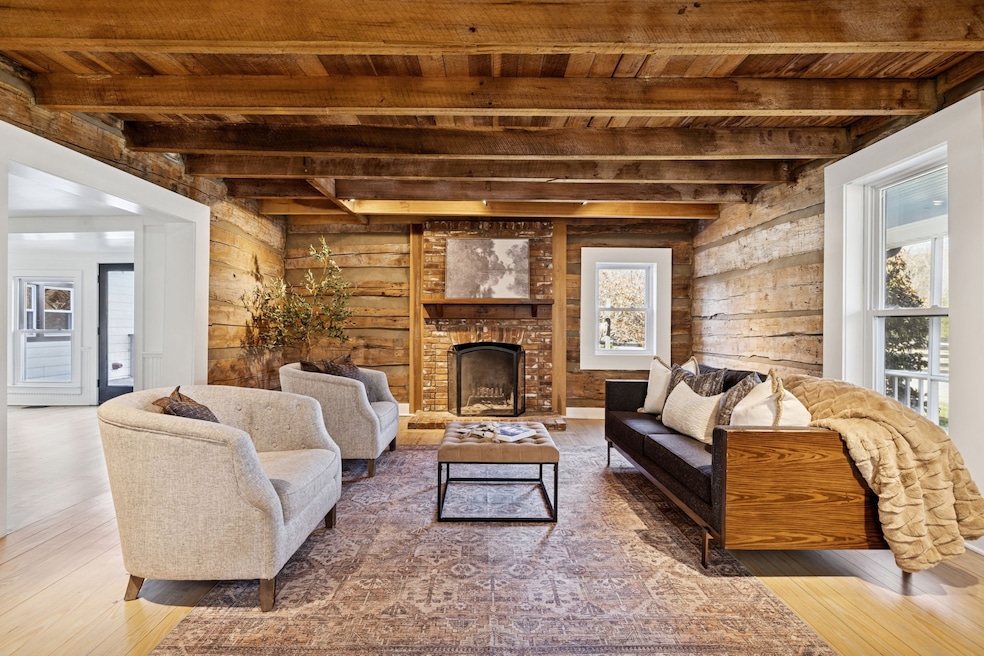
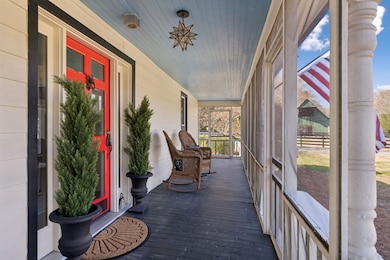
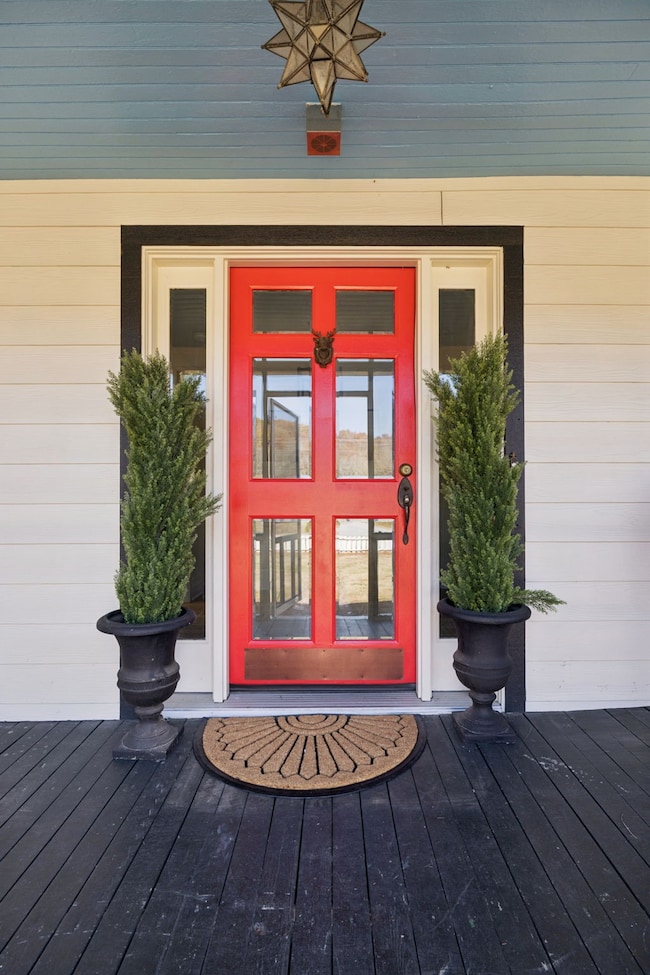
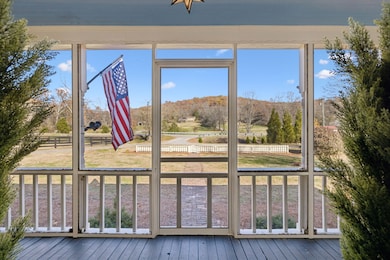
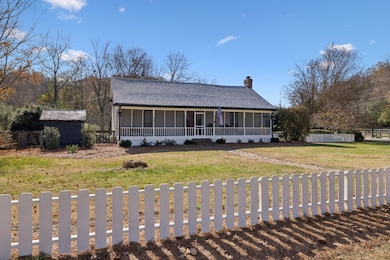
Charming 4BR 3 BA historic home on 5.04 acres, just minutes from Leiper’s Fork and one property away from the Natchez Trace Parkway. The original 1897 log home has been thoughtfully expanded, offering the perfect blend of character and comfort. This home features living spaces that are on the main level, including a primary suite and a second bedroom ideal for a nursery or office. The open kitchen flows to the dining area and cozy log living room, creating an inviting gathering space. A substantial great room offers endless possibilities — perfect for a game room, bonus room, or entertaining. Upstairs you have 2 bedrooms, a newly renovated bath and loft/office area. Enjoy peaceful mornings on the screened front porch, sunsets from the side deck off the kitchen, and private views from the upstairs deck. An oversized three-car garage provides ample space for vehicles, storage, or hobbies. Small fenced pasture is ideal for the animals in your life, leaving additional unfenced acreage to plan your vision. This home offers a warm, country feel with easy access to Franklin and Leiper’s Fork — a rare find blending history, space, and convenience.
Listing Agent
Compass RE Brokerage Phone: 6155042118 License # 266090 Listed on: 12/02/2025

Home Details
Home Type
- Single Family
Est. Annual Taxes
- $3,025
Year Built
- Built in 1897
Lot Details
- 5.04 Acre Lot
- Split Rail Fence
Parking
- 3 Car Garage
- Garage Door Opener
Interior Spaces
- 3,664 Sq Ft Home
- Property has 2 Levels
- Family Room with Fireplace
- Separate Formal Living Room
- Screened Porch
Kitchen
- Gas Range
- Dishwasher
- Stainless Steel Appliances
- Kitchen Island
- Disposal
Flooring
- Wood
- Tile
Bedrooms and Bathrooms
- 4 Bedrooms | 2 Main Level Bedrooms
- 3 Full Bathrooms
- Double Vanity
Outdoor Features
- Deck
Schools
- Hillsboro Elementary/ Middle School
- Independence High School
Utilities
- Central Heating and Cooling System
- Heating System Uses Propane
- Septic Tank
Community Details
- No Home Owners Association
- Leipers Fork Subdivision
Listing and Financial Details
- Assessor Parcel Number 094093 05605 00003093
Map
Home Values in the Area
Average Home Value in this Area
Tax History
| Year | Tax Paid | Tax Assessment Tax Assessment Total Assessment is a certain percentage of the fair market value that is determined by local assessors to be the total taxable value of land and additions on the property. | Land | Improvement |
|---|---|---|---|---|
| 2025 | $3,025 | $246,825 | $132,150 | $114,675 |
| 2024 | $3,025 | $160,900 | $66,075 | $94,825 |
| 2023 | $3,025 | $160,900 | $66,075 | $94,825 |
| 2022 | $3,025 | $160,900 | $66,075 | $94,825 |
| 2021 | $3,025 | $160,900 | $66,075 | $94,825 |
| 2020 | $2,345 | $105,625 | $44,050 | $61,575 |
| 2019 | $2,345 | $105,625 | $44,050 | $61,575 |
| 2018 | $2,271 | $105,625 | $44,050 | $61,575 |
| 2017 | $1,965 | $105,625 | $44,050 | $61,575 |
| 2016 | $1,965 | $91,375 | $44,050 | $47,325 |
| 2015 | -- | $68,100 | $33,875 | $34,225 |
| 2014 | -- | $68,100 | $33,875 | $34,225 |
Property History
| Date | Event | Price | List to Sale | Price per Sq Ft |
|---|---|---|---|---|
| 12/05/2025 12/05/25 | For Sale | $2,250,000 | 0.0% | $614 / Sq Ft |
| 12/04/2025 12/04/25 | Price Changed | $2,250,000 | -- | $614 / Sq Ft |
Purchase History
| Date | Type | Sale Price | Title Company |
|---|---|---|---|
| Warranty Deed | $400,000 | Bridgehouse Title Llc | |
| Warranty Deed | $1,450,000 | Bridgehouse Title Llc | |
| Interfamily Deed Transfer | -- | -- | |
| Interfamily Deed Transfer | -- | -- |
Mortgage History
| Date | Status | Loan Amount | Loan Type |
|---|---|---|---|
| Previous Owner | $1,563,750 | Purchase Money Mortgage | |
| Previous Owner | $498,000 | No Value Available |
Source: Realtracs
MLS Number: 3056608
APN: 093-056.05
Disclaimer: Certain information contained herein is derived from information provided by parties other than Homes.com. All information provided is deemed reliable, but is not guaranteed to be accurate and should be independently verified.
![]() Based on information submitted to the MLS GRID. All data is obtained from various sources and may not have been verified by broker or MLS GRID. Supplied Open House Information is subject to change without notice. All information should be independently reviewed and verified for accuracy. Properties may or may not be listed by the office/agent presenting the information. Some IDX listings have been excluded from this website.
Based on information submitted to the MLS GRID. All data is obtained from various sources and may not have been verified by broker or MLS GRID. Supplied Open House Information is subject to change without notice. All information should be independently reviewed and verified for accuracy. Properties may or may not be listed by the office/agent presenting the information. Some IDX listings have been excluded from this website.
The Digital Millennium Copyright Act of 1998, 17 U.S.C. § 512 (the “DMCA”) provides recourse for copyright owners who believe that material appearing on the Internet infringes their rights under U.S. copyright law. If you believe in good faith that any content or material made available in connection with our website or services infringes your copyright, you (or your agent) may send us a notice requesting that the content or material be removed, or access to it blocked.
Notices must be sent in writing by email to DMCAnotice@MLSGrid.com.
The DMCA requires that your notice of alleged copyright infringement include the following information:
(1) description of the copyrighted work that is the subject of claimed infringement;
(2) description of the alleged infringing content and information sufficient to permit us to locate the content;
(3) contact information for you, including your address, telephone number and email address;
(4) a statement by you that you have a good faith belief that the content in the manner complained of is not authorized by the copyright owner, or its agent, or by the operation of any law;
(5) a statement by you, signed under penalty of perjury, that the information in the notification is accurate and that you have the authority to enforce the copyrights that are claimed to be infringed; and
(6) a physical or electronic signature of the copyright owner or a person authorized to act on the copyright owner’s behalf. Failure to include all of the above information may result in the delay of the processing of your complaint.
- 0 Leipers Creek Rd Unit RTC2994999
- 5580 Powell Sullivan Rd
- 4308 Old Hillsboro Rd
- 5610 Hargrove Rd
- 5584 Wilkins Branch Rd
- 3349 Sweeney Hollow Rd
- 0 Alex Ct
- 5450 Old Highway 96
- 0 Sweeney Hollow Rd
- 5518 Sycamore St
- 5508 Sycamore St
- 4259 Old Hillsboro Rd
- 3360 Sweeney Hollow Rd
- 3385 Bailey Rd
- 3317 Floyd Rd
- 5313 Crown Dr
- 5551 Parker Branch Rd
- 0 Old Hillsboro Rd Unit RTC3046357
- 5569 Parker Branch Rd
- 5504 Parker Branch Rd
- 5576 Hargrove Rd
- 5191 Still House Hollow Rd
- 5045 Kathryn Ave
- 714 Shelley Ln
- 193 Acadia Ave
- 430 Wiregrass Ln
- 3031 Conar St
- 373 Byron Way
- 1759 Fry Rd
- 911 Jewell Ave
- 928 Jewell Ave
- 5079 Donovan St
- 7209 Sir William Dr
- 3218 Boyd Mill Ave
- 7103 Dogwood Ct
- 1101 Downs Blvd Unit 147
- 1101 Downs Blvd Unit 117
- 7872 Oscar Green Rd
- 110 Velena St
- 454 Cardel Ln