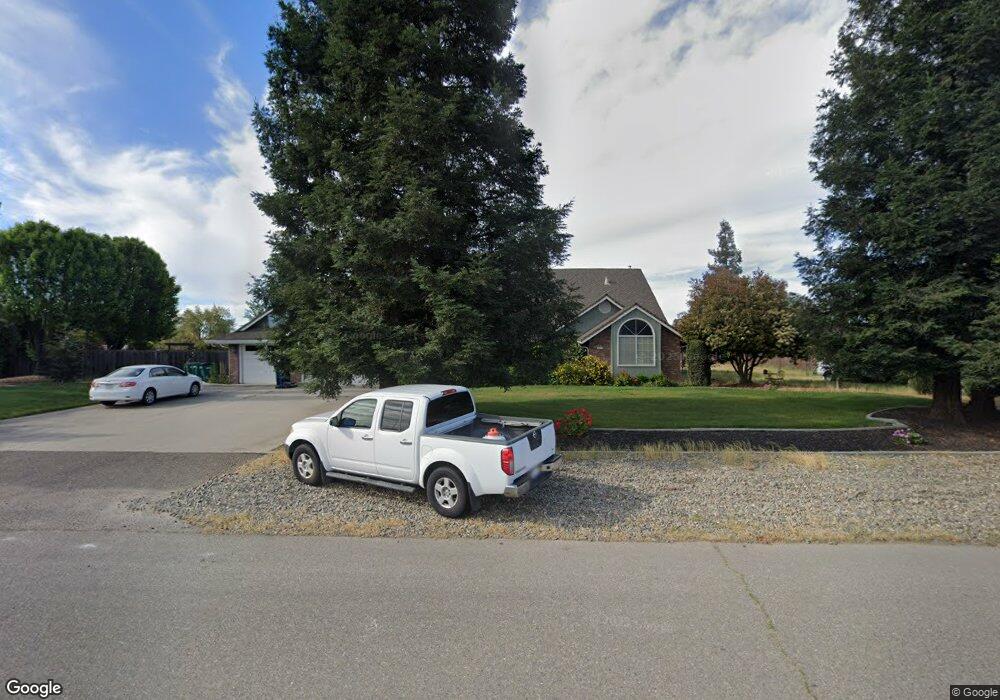
5831 Padre Ct Atwater, CA 95301
McSwain NeighborhoodEstimated Value: $745,773 - $800,000
3
Beds
2
Baths
2,505
Sq Ft
$309/Sq Ft
Est. Value
About This Home
This home is located at 5831 Padre Ct, Atwater, CA 95301 and is currently estimated at $774,943, approximately $309 per square foot. 5831 Padre Ct is a home located in Merced County with nearby schools including McSwain Elementary School, Buhach Colony High School, and Landmark Christian School.
Ownership History
Date
Name
Owned For
Owner Type
Purchase Details
Closed on
Feb 22, 2021
Sold by
Wakefield Gregory and Wakefield Catharine
Bought by
Heredia David and Medeiros Jennifer R
Current Estimated Value
Home Financials for this Owner
Home Financials are based on the most recent Mortgage that was taken out on this home.
Original Mortgage
$464,000
Outstanding Balance
$414,997
Interest Rate
2.7%
Mortgage Type
New Conventional
Estimated Equity
$359,946
Purchase Details
Closed on
Oct 5, 2016
Sold by
Wakefield Gregory D and Wakefield Catharine J
Bought by
Wakefield Gregory and Wakefield Catharine
Purchase Details
Closed on
Jan 11, 1999
Sold by
Bud Raymond
Bought by
Wakefield Gregory D and Wakefield Catharine J
Home Financials for this Owner
Home Financials are based on the most recent Mortgage that was taken out on this home.
Original Mortgage
$190,000
Interest Rate
6.77%
Create a Home Valuation Report for This Property
The Home Valuation Report is an in-depth analysis detailing your home's value as well as a comparison with similar homes in the area
Home Values in the Area
Average Home Value in this Area
Purchase History
| Date | Buyer | Sale Price | Title Company |
|---|---|---|---|
| Heredia David | $580,000 | Transcounty Title Company | |
| Wakefield Gregory | -- | None Available | |
| Wakefield Gregory D | $200,000 | Chicago Title Co |
Source: Public Records
Mortgage History
| Date | Status | Borrower | Loan Amount |
|---|---|---|---|
| Open | Heredia David | $464,000 | |
| Previous Owner | Wakefield Gregory D | $190,000 |
Source: Public Records
Tax History Compared to Growth
Tax History
| Year | Tax Paid | Tax Assessment Tax Assessment Total Assessment is a certain percentage of the fair market value that is determined by local assessors to be the total taxable value of land and additions on the property. | Land | Improvement |
|---|---|---|---|---|
| 2025 | $6,400 | $627,809 | $151,540 | $476,269 |
| 2024 | $6,400 | $615,500 | $148,569 | $466,931 |
| 2023 | $6,275 | $603,432 | $145,656 | $457,776 |
| 2022 | $6,196 | $591,600 | $142,800 | $448,800 |
| 2021 | $3,446 | $321,316 | $72,408 | $248,908 |
| 2020 | $3,411 | $318,022 | $71,666 | $246,356 |
| 2019 | $3,340 | $311,787 | $70,261 | $241,526 |
| 2018 | $3,267 | $305,675 | $68,884 | $236,791 |
| 2017 | $3,224 | $299,683 | $67,534 | $232,149 |
| 2016 | $3,180 | $293,808 | $66,210 | $227,598 |
| 2015 | $3,139 | $289,396 | $65,216 | $224,180 |
| 2014 | $3,069 | $283,728 | $63,939 | $219,789 |
Source: Public Records
Map
Nearby Homes
- 3465 Giannini Rd
- 701 Palmer Place
- 22 Rancho Grande Cir
- 100 Rancho Grande Cir
- 717 Nicklaus Ct
- 1384 Almador Terrace
- 1405 Jantzen Ave
- 92 Rancho Grande Cir
- 152 Seville Ct Unit 152
- 152 Seville Ct
- 824 Valle Grande Dr Unit 2
- 76 Rancho Grande Cir
- 708 Vista Del Rey Dr
- 3026 Station Ave
- 2659 Clydesdale Ave
- 134 E Fir Ave
- 3450 Station Ave
- 3122 Belmira Rd
- 400 Elm Ave
- 3447 Manchester Rd
- 5805 Padre Ct
- 5857 Padre Ct
- 5824 Padre Ct
- 5796 Padre Ct
- 5777 Padre Ct
- 5883 Padre Ct
- 5850 Padre Ct
- 5870 Sugarplum Ct
- 5850 Sugarplum Ct
- 5900 Sugarplum Dr
- 5770 Padre Ct
- 5820 Sugarplum Ct
- 5876 Padre Ct
- 5757 Padre Ct
- 5930 Sugarplum Dr
- 5750 Padre Ct
- 3245 Monarch Ave
- 3375 Monarch Ave
- 5881 Sugarplum Ct
- 5907 Sugarplum Dr