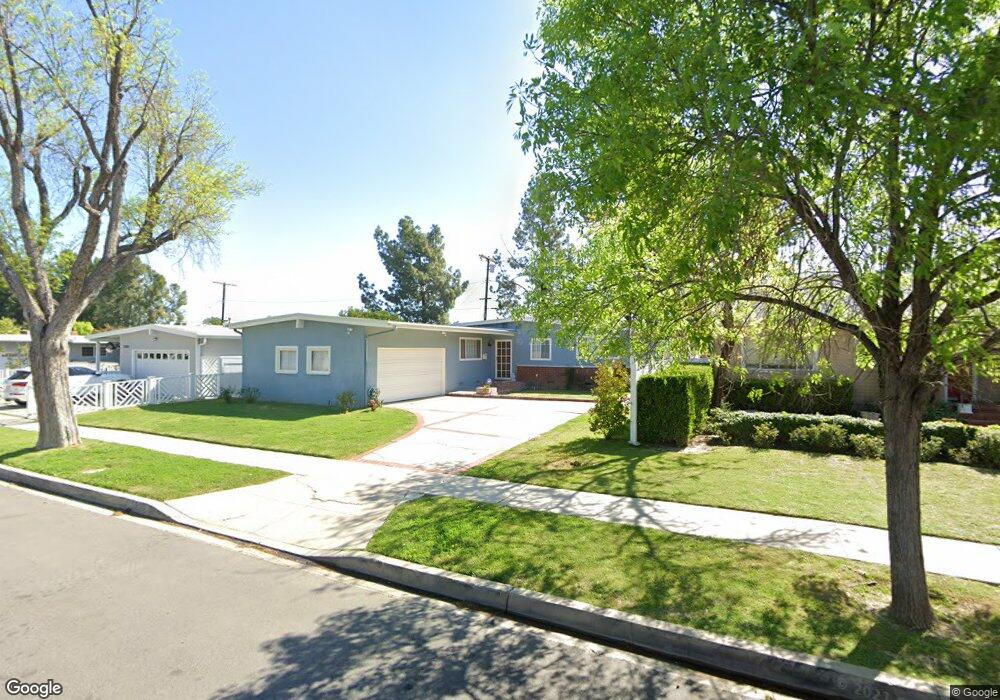
5900 Wish Ave Encino, CA 91316
Estimated Value: $1,087,382 - $1,232,000
3
Beds
2
Baths
1,364
Sq Ft
$856/Sq Ft
Est. Value
About This Home
This home is located at 5900 Wish Ave, Encino, CA 91316 and is currently estimated at $1,167,846, approximately $856 per square foot. 5900 Wish Ave is a home located in Los Angeles County with nearby schools including William Mulholland Middle, Emelita Street Elementary, and Encino Charter Elementary.
Ownership History
Date
Name
Owned For
Owner Type
Purchase Details
Closed on
Dec 30, 2010
Sold by
Wills Amy Loren
Bought by
Wills Amy Loren and Amy L Wills Revocable Trust
Current Estimated Value
Purchase Details
Closed on
May 1, 2001
Sold by
Collins John
Bought by
Wills Amy
Home Financials for this Owner
Home Financials are based on the most recent Mortgage that was taken out on this home.
Original Mortgage
$252,000
Outstanding Balance
$88,589
Interest Rate
6.89%
Estimated Equity
$1,079,257
Purchase Details
Closed on
Mar 16, 2000
Sold by
Imani Farid
Bought by
Collins John and Collins Elaine
Home Financials for this Owner
Home Financials are based on the most recent Mortgage that was taken out on this home.
Original Mortgage
$228,000
Interest Rate
8.24%
Purchase Details
Closed on
Jul 16, 1999
Sold by
Imani Sharareh
Bought by
Imani Farid
Create a Home Valuation Report for This Property
The Home Valuation Report is an in-depth analysis detailing your home's value as well as a comparison with similar homes in the area
Home Values in the Area
Average Home Value in this Area
Purchase History
| Date | Buyer | Sale Price | Title Company |
|---|---|---|---|
| Wills Amy Loren | -- | None Available | |
| Wills Amy | $315,000 | Commonwealth Title | |
| Collins John | $285,000 | Commonwealth Title | |
| Imani Farid | -- | -- |
Source: Public Records
Mortgage History
| Date | Status | Borrower | Loan Amount |
|---|---|---|---|
| Open | Wills Amy | $252,000 | |
| Previous Owner | Collins John | $228,000 |
Source: Public Records
Tax History
| Year | Tax Paid | Tax Assessment Tax Assessment Total Assessment is a certain percentage of the fair market value that is determined by local assessors to be the total taxable value of land and additions on the property. | Land | Improvement |
|---|---|---|---|---|
| 2025 | $5,828 | $474,634 | $188,344 | $286,290 |
| 2024 | $5,828 | $465,328 | $184,651 | $280,677 |
| 2023 | $5,718 | $456,205 | $181,031 | $275,174 |
| 2022 | $5,455 | $447,261 | $177,482 | $269,779 |
| 2021 | $5,385 | $438,492 | $174,002 | $264,490 |
| 2019 | $5,225 | $425,488 | $168,842 | $256,646 |
| 2018 | $5,132 | $417,146 | $165,532 | $251,614 |
| 2016 | $4,897 | $400,950 | $159,105 | $241,845 |
| 2015 | $4,826 | $394,929 | $156,716 | $238,213 |
| 2014 | $4,846 | $387,194 | $153,647 | $233,547 |
Source: Public Records
Map
Nearby Homes
- 17156 Bullock St
- 5751 Andasol Ave
- 17140 Burbank Blvd Unit 207
- 17435 Burma St
- 17329 Burbank Blvd
- 17469 Bullock St
- 17230 Silver Ln
- 17415 Burbank Blvd
- 5919 Encino Ave
- 6110 Shoshone Ave
- 17341 Cumpston St
- 5344 Oak Park Ave
- 6402 Graves Ave
- 6160 Shoshone Ave
- 5330 Amestoy Ave
- 6435 Aldea Ave
- 5457 Encino Ave
- 17629 Burbank Blvd
- 17424 Cumpston St
- 5301 Balboa Blvd Unit F8
Your Personal Tour Guide
Ask me questions while you tour the home.