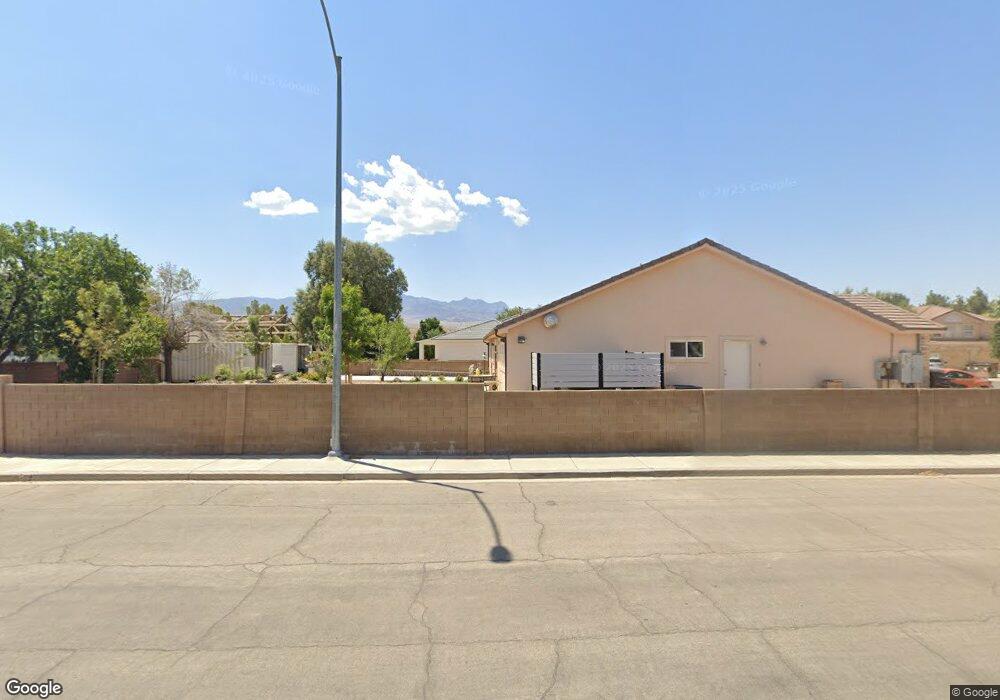
245 W First South St Bunkerville, NV 89007
Estimated Value: $573,000 - $709,000
5
Beds
3
Baths
2,558
Sq Ft
$246/Sq Ft
Est. Value
About This Home
This home is located at 245 W First South St, Bunkerville, NV 89007 and is currently estimated at $629,538, approximately $246 per square foot. 245 W First South St is a home with nearby schools including Joseph L. Bowler Sr. Elementary School, Charles Arthur Hughes Middle School, and Virgin Valley High School.
Ownership History
Date
Name
Owned For
Owner Type
Purchase Details
Closed on
May 9, 2022
Sold by
Tilton Andrea A
Bought by
Andrea A Tilton Family Trust
Current Estimated Value
Purchase Details
Closed on
Apr 25, 2022
Sold by
Anderson Kendall Dean
Bought by
Tilton Andrea A
Purchase Details
Closed on
Jul 29, 2014
Sold by
Anderson Celeste
Bought by
Anderson Kendall Dean
Home Financials for this Owner
Home Financials are based on the most recent Mortgage that was taken out on this home.
Original Mortgage
$47,000
Interest Rate
4.16%
Mortgage Type
Unknown
Purchase Details
Closed on
Jul 2, 2014
Sold by
Lowell Kent Bunker Trust
Bought by
Anderson Kendall Dean
Home Financials for this Owner
Home Financials are based on the most recent Mortgage that was taken out on this home.
Original Mortgage
$47,000
Interest Rate
4.16%
Mortgage Type
Unknown
Create a Home Valuation Report for This Property
The Home Valuation Report is an in-depth analysis detailing your home's value as well as a comparison with similar homes in the area
Home Values in the Area
Average Home Value in this Area
Purchase History
| Date | Buyer | Sale Price | Title Company |
|---|---|---|---|
| Andrea A Tilton Family Trust | -- | None Listed On Document | |
| Tilton Andrea A | $95,000 | Stewart Title & Trust Of Tucso | |
| Anderson Kendall Dean | -- | Mesquite Title Co | |
| Anderson Kendall Dean | $87,000 | Mesquite Title Co |
Source: Public Records
Mortgage History
| Date | Status | Borrower | Loan Amount |
|---|---|---|---|
| Previous Owner | Anderson Kendall Dean | $47,000 |
Source: Public Records
Tax History Compared to Growth
Tax History
| Year | Tax Paid | Tax Assessment Tax Assessment Total Assessment is a certain percentage of the fair market value that is determined by local assessors to be the total taxable value of land and additions on the property. | Land | Improvement |
|---|---|---|---|---|
| 2025 | $5,156 | $205,726 | $19,110 | $186,616 |
| 2024 | $442 | $205,726 | $19,110 | $186,616 |
| 2023 | $442 | $17,472 | $17,472 | $0 |
| 2022 | $671 | $27,672 | $14,560 | $13,112 |
| 2021 | $621 | $25,927 | $13,741 | $12,186 |
| 2020 | $575 | $24,593 | $12,740 | $11,853 |
| 2019 | $539 | $24,188 | $12,740 | $11,448 |
| 2018 | $514 | $23,419 | $12,740 | $10,679 |
| 2017 | $588 | $23,325 | $12,740 | $10,585 |
| 2016 | $481 | $19,392 | $9,100 | $10,292 |
| 2015 | $480 | $19,052 | $9,100 | $9,952 |
| 2014 | $465 | $17,916 | $9,100 | $8,816 |
Source: Public Records
Map
Nearby Homes
- 1389 Harbour Dr
- 840 W Pioneer
- 463 Hagens Aly
- 364 Sam Way
- 287 Sam Way
- 294 Sam Way
- 375 Habib Way
- Unit 1 Plan at Vista Del Luna
- Beckett Plan at The Fields
- Weston Plan at The Fields
- Graham Plan at The Fields
- 254 Reber Dr
- 271 Concord Dr
- 777 2nd St S
- 581 Emperor Ln Unit 1
- 479 Apogee Crest St
- 468 Apogee Crest St
- 844 Sagedell Rd
- 228 Hiawatha Way
- 262 Thistle St
- 235 W First South St
- 255 W First South St
- 165 S 2nd West St
- 275 W First South St
- 175 S 2nd West St
- 180 W Second South St
- 75 S Second West St
- 144 S 2nd West St
- 124 S 2nd West St
- 260 W First South St
- 205 S 2nd West St
- 142 Chapel Way
- 65 S Second West St
- 122 Chapel Way
- 255 S First West St
- 162 Chapel Way
- 90 S Second West St
- 182 Chapel Way
- 215 S 2nd West St
- 70 S Second West St