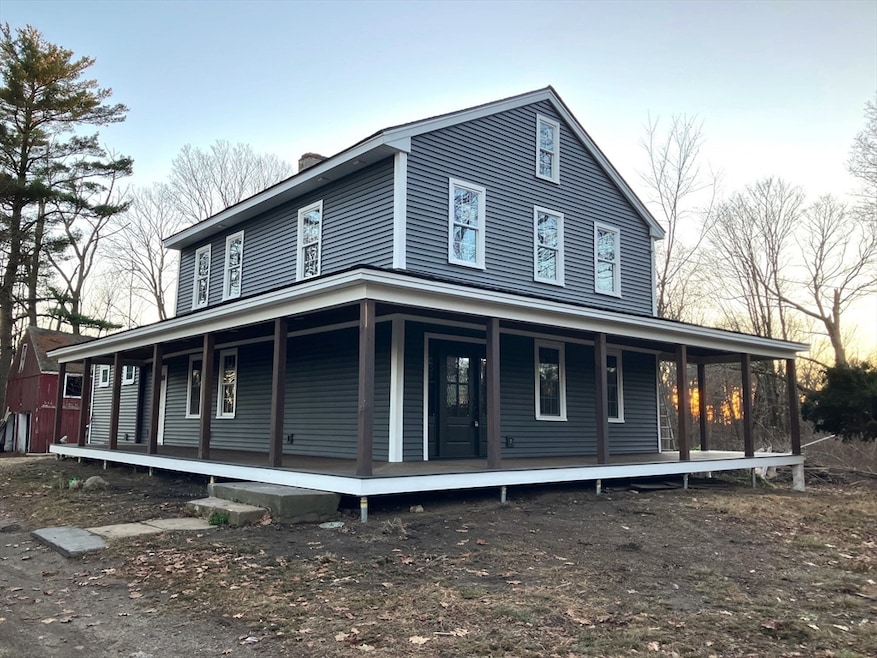


35 West St Petersham, MA 01366
Estimated payment $4,260/month
Highlights
- Golf Course Community
- Barn or Stable
- Main Floor Primary Bedroom
- Community Stables
- Post and Beam
- 2 Fireplaces
About This Home
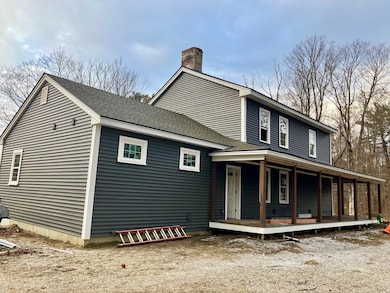
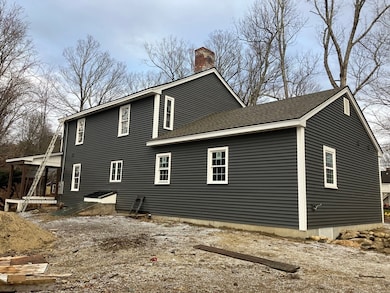
When complete, this home will have all the qualities of new construction with the character of an antique farmhouse. If that appeals to you, come participate in the finishing details and make it your own. Structural renovation is complete. The house is now an open concept first floor with a new Master Suite addition in the rear. Second floor has three very generous bedrooms and a second full bath. All new electric and plumbing. Heat and AC will be provided by efficient mini split systems. Plan is for full hardwoods and tile, custom cabinets, soapstone counters, custom tile baths. Barn will be restored to full stability and function. Come participate with this top shelf builder to make the details be your choices.
Home Details
Home Type
- Single Family
Est. Annual Taxes
- $3,015
Year Built
- Built in 1870
Lot Details
- 0.88 Acre Lot
- Cleared Lot
- Property is zoned RA
Parking
- 1 Car Detached Garage
- Off-Street Parking
Home Design
- Post and Beam
- Farmhouse Style Home
- Stone Foundation
- Shingle Roof
- Concrete Perimeter Foundation
Interior Spaces
- 2,304 Sq Ft Home
- 2 Fireplaces
- Insulated Windows
- Insulated Doors
- Laundry on main level
Bedrooms and Bathrooms
- 4 Bedrooms
- Primary Bedroom on Main
- 2 Full Bathrooms
Basement
- Partial Basement
- Crawl Space
Utilities
- Ductless Heating Or Cooling System
- 2 Heating Zones
- Heating Available
- 200+ Amp Service
- Private Water Source
- Electric Water Heater
- Private Sewer
Additional Features
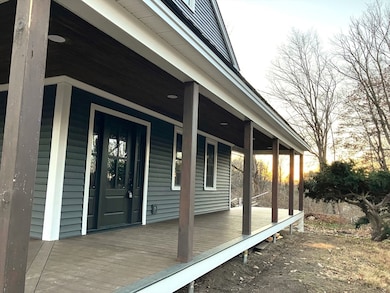
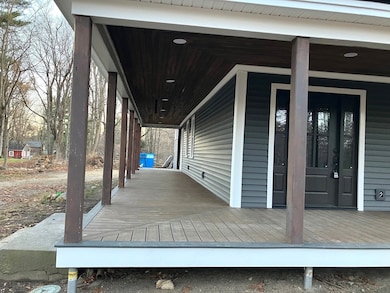
- Porch
- Property is near schools
- Barn or Stable
Listing and Financial Details
- Tax Lot 92
- Assessor Parcel Number 20192,3213214
Community Details
Overview
- No Home Owners Association
- Near Conservation Area
Recreation
- Golf Course Community
- Community Stables
- Jogging Path
Map
Home Values in the Area
Average Home Value in this Area
Tax History
| Year | Tax Paid | Tax Assessment Tax Assessment Total Assessment is a certain percentage of the fair market value that is determined by local assessors to be the total taxable value of land and additions on the property. | Land | Improvement |
|---|---|---|---|---|
| 2025 | $3,015 | $208,100 | $54,400 | $153,700 |
| 2024 | $3,066 | $214,400 | $54,400 | $160,000 |
| 2023 | $2,828 | $179,100 | $51,800 | $127,300 |
| 2022 | $2,425 | $179,100 | $51,800 | $127,300 |
| 2021 | $2,638 | $172,300 | $47,100 | $125,200 |
| 2020 | $2,777 | $159,900 | $40,800 | $119,100 |
| 2019 | $2,859 | $168,900 | $35,800 | $133,100 |
| 2018 | $2,742 | $167,500 | $34,400 | $133,100 |
| 2017 | $2,723 | $168,200 | $36,400 | $131,800 |
| 2016 | $2,762 | $168,200 | $36,400 | $131,800 |
| 2015 | $2,837 | $167,000 | $36,400 | $130,600 |
| 2014 | $2,660 | $167,000 | $36,400 | $130,600 |
Property History
| Date | Event | Price | List to Sale | Price per Sq Ft |
|---|---|---|---|---|
| 11/24/2025 11/24/25 | For Sale | $759,000 | -- | $329 / Sq Ft |
Purchase History
| Date | Type | Sale Price | Title Company |
|---|---|---|---|
| Quit Claim Deed | $144,500 | None Available | |
| Quit Claim Deed | $144,500 | None Available | |
| Quit Claim Deed | -- | None Available | |
| Quit Claim Deed | -- | None Available | |
| Quit Claim Deed | -- | None Available | |
| Quit Claim Deed | $100,000 | None Available | |
| Quit Claim Deed | $100,000 | None Available | |
| Quit Claim Deed | $100,000 | None Available | |
| Quit Claim Deed | -- | -- | |
| Quit Claim Deed | -- | -- | |
| Quit Claim Deed | -- | -- | |
| Foreclosure Deed | $42,062 | -- | |
| Foreclosure Deed | $42,062 | -- | |
| Deed | $48,500 | -- | |
| Foreclosure Deed | $42,062 | -- | |
| Deed | $48,500 | -- |
Mortgage History
| Date | Status | Loan Amount | Loan Type |
|---|---|---|---|
| Open | $441,690 | Commercial | |
| Closed | $441,690 | Commercial | |
| Previous Owner | $220,000 | Commercial | |
| Previous Owner | $275,000 | Purchase Money Mortgage | |
| Previous Owner | $30,000 | No Value Available | |
| Previous Owner | $11,100 | Purchase Money Mortgage |
Source: MLS Property Information Network (MLS PIN)
MLS Number: 73457570
APN: PETE-000000-000000-000079
Disclaimer: Certain information contained herein is derived from information provided by parties other than Homes.com. All information provided is deemed reliable, but is not guaranteed to be accurate and should be independently verified.
![]() The property listing data and information, or the Images, set forth herein were provided to MLS Property Information Network, Inc. from third party sources, including sellers, lessors and public records, and were compiled by MLS Property Information Network, Inc. The property listing data and information, and the Images, are for the personal, non-commercial use of consumers having a good faith interest in purchasing or leasing listed properties of the type displayed to them and may not be used for any purpose other than to identify prospective properties which such consumers may have a good faith interest in purchasing or leasing. MLS Property Information Network, Inc. and its subscribers disclaim any and all representations and warranties as to the accuracy of the property listing data and information, or as to the accuracy of any of the Images, set forth herein.
The property listing data and information, or the Images, set forth herein were provided to MLS Property Information Network, Inc. from third party sources, including sellers, lessors and public records, and were compiled by MLS Property Information Network, Inc. The property listing data and information, and the Images, are for the personal, non-commercial use of consumers having a good faith interest in purchasing or leasing listed properties of the type displayed to them and may not be used for any purpose other than to identify prospective properties which such consumers may have a good faith interest in purchasing or leasing. MLS Property Information Network, Inc. and its subscribers disclaim any and all representations and warranties as to the accuracy of the property listing data and information, or as to the accuracy of any of the Images, set forth herein.
- 28 Spring St
- 42 New Salem Rd
- 15 Common St
- 27 Popple Camp Rd
- 0 Popple Camp Rd Unit 73432026
- 193 Nichewaug Rd
- 204 East St
- 0 Nichewaug Rd
- Back Lot 0 Petersham Rd
- 47 Harty Dr
- 32 Edward Ln
- 21 Varney Ln
- 31 Edward Ln
- 37 Gauthier Rd
- 30 Woodward Rd
- 0 Carter Pond Rd
- 20 Dana Rd
- 275 Petersham Rd
- 23 Dana Rd
- 1082 Old Dana Rd
- 2154 Main St Unit 1
- 50 Park St Unit 2
- 129 Union St
- 232 Pequoig Ave Unit 2
- 419 E River St
- 931 Worcester Rd Unit 1
- 12-14-14 E Main St Unit 2
- 25 High St Unit 1
- 15 N Main St Unit 3
- 166-168-168 W Main St Unit 168-7
- 166-168-168 W Main St Unit 168-5
- 40 Moran St
- 14 Coleman St Unit 2
- 13 Greenwood St Unit 3
- 22 Knowlton St Unit 3B
- 33 Ash St Unit 1
- 16 Oriole St Unit 4
- 164 W Broadway Unit B
- 133 Pleasant St Unit 1
- 27 Oak St Unit 3
