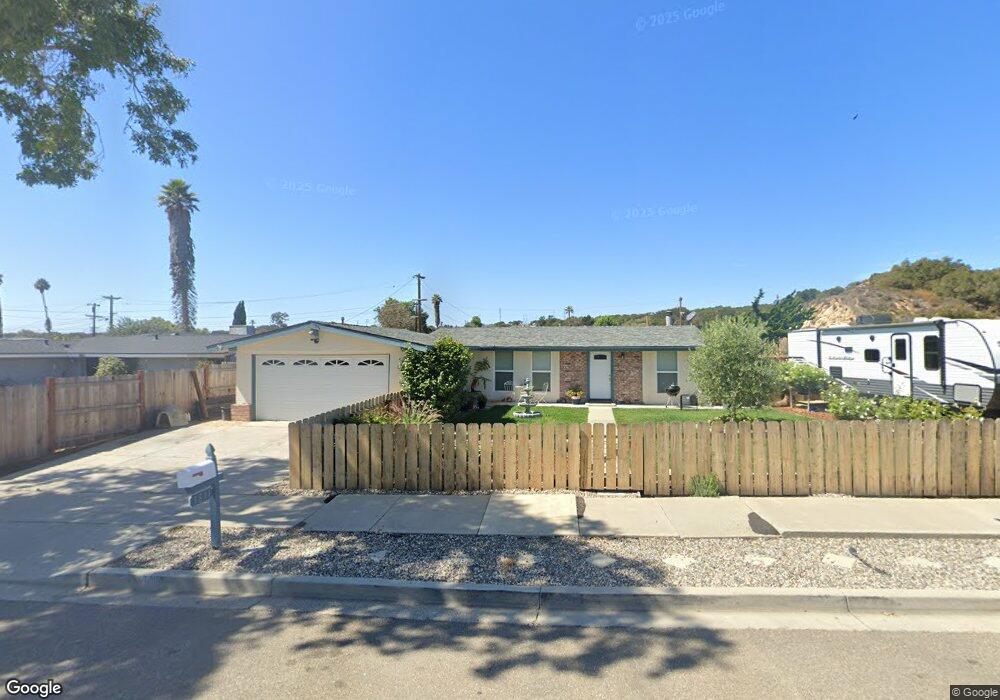
3891 Via Parte Lompoc, CA 93436
Mission Hills NeighborhoodEstimated Value: $472,000 - $582,000
3
Beds
2
Baths
1,080
Sq Ft
$495/Sq Ft
Est. Value
About This Home
This home is located at 3891 Via Parte, Lompoc, CA 93436 and is currently estimated at $535,078, approximately $495 per square foot. 3891 Via Parte is a home located in Santa Barbara County with nearby schools including Los Berros Visual and Performing Arts Academy, Cabrillo High School, and Olive Grove Charter - Lompoc.
Ownership History
Date
Name
Owned For
Owner Type
Purchase Details
Closed on
Apr 10, 2020
Sold by
Pulido Maria
Bought by
Pulido Arturo
Current Estimated Value
Home Financials for this Owner
Home Financials are based on the most recent Mortgage that was taken out on this home.
Original Mortgage
$321,586
Outstanding Balance
$283,799
Interest Rate
3.2%
Mortgage Type
Commercial
Estimated Equity
$251,279
Purchase Details
Closed on
Apr 8, 2020
Sold by
Mccoy Sean
Bought by
Pulido Arturo
Home Financials for this Owner
Home Financials are based on the most recent Mortgage that was taken out on this home.
Original Mortgage
$321,586
Outstanding Balance
$283,799
Interest Rate
3.2%
Mortgage Type
Commercial
Estimated Equity
$251,279
Purchase Details
Closed on
Apr 9, 2019
Sold by
Debruin Edward De and Debruin Janice De
Bought by
Stableford Pamela K and Pamela K Stableford Trust 2002
Create a Home Valuation Report for This Property
The Home Valuation Report is an in-depth analysis detailing your home's value as well as a comparison with similar homes in the area
Home Values in the Area
Average Home Value in this Area
Purchase History
| Date | Buyer | Sale Price | Title Company |
|---|---|---|---|
| Pulido Arturo | -- | Fidelity National Title | |
| Pulido Arturo | $320,000 | Fidelity National Title Co | |
| Stableford Pamela K | $320,000 | Fidelity National Title Co |
Source: Public Records
Mortgage History
| Date | Status | Borrower | Loan Amount |
|---|---|---|---|
| Open | Pulido Arturo | $321,586 |
Source: Public Records
Tax History
| Year | Tax Paid | Tax Assessment Tax Assessment Total Assessment is a certain percentage of the fair market value that is determined by local assessors to be the total taxable value of land and additions on the property. | Land | Improvement |
|---|---|---|---|---|
| 2025 | $3,780 | $349,963 | $109,363 | $240,600 |
| 2023 | $3,780 | $336,375 | $105,117 | $231,258 |
| 2022 | $3,716 | $329,780 | $103,056 | $226,724 |
| 2021 | $3,760 | $323,315 | $101,036 | $222,279 |
| 2020 | $3,719 | $320,000 | $100,000 | $220,000 |
| 2019 | $1,623 | $145,815 | $65,190 | $80,625 |
| 2018 | $1,597 | $142,957 | $63,912 | $79,045 |
| 2017 | $1,566 | $140,155 | $62,659 | $77,496 |
| 2016 | $1,537 | $137,408 | $61,431 | $75,977 |
| 2014 | $1,501 | $132,695 | $59,324 | $73,371 |
Source: Public Records
Map
Nearby Homes
- 3838 Via Mitad
- 3770 Rucker Rd
- 3578 Via Lato
- 1588 Calle Portos
- 372 Falcon Crest Dr
- 384 Falcon Crest Dr
- 972 Pellham Dr
- 892 Onstott Rd
- 832 Onstott Rd
- 250 Saint Andrews Way
- 649 Burning Tree Way
- 757 Onstott Rd
- 4166 Oakwood Ct
- 4173 Oakwood Ct
- 778 Tamarisk Dr
- 4473 Greenbrier Rd
- 2655 Adobe Falls Rd
- 372 Oak Hill Dr
- 0 Oak Hill Dr Unit 24-783
- 3825 Saturn Ave Unit 1
- 3883 Via Parte
- 3877 Via Parte
- 1589 Calle Lindero
- 3894 Via Lato
- 1599 Calle Lindero
- 3894 Via Parte
- 3888 Via Parte
- 1609 Calle Diez
- 1607 Calle Lindero
- 3869 Via Parte
- 3882 Via Lato
- 1613 Calle Lindero
- 3872 Via Parte
- 1620 Calle Lindero
- 3863 Via Parte
- 1619 Calle Diez
- 3876 Via Lato
- 1621 Calle Lindero
- 3864 Via Parte
Your Personal Tour Guide
Ask me questions while you tour the home.