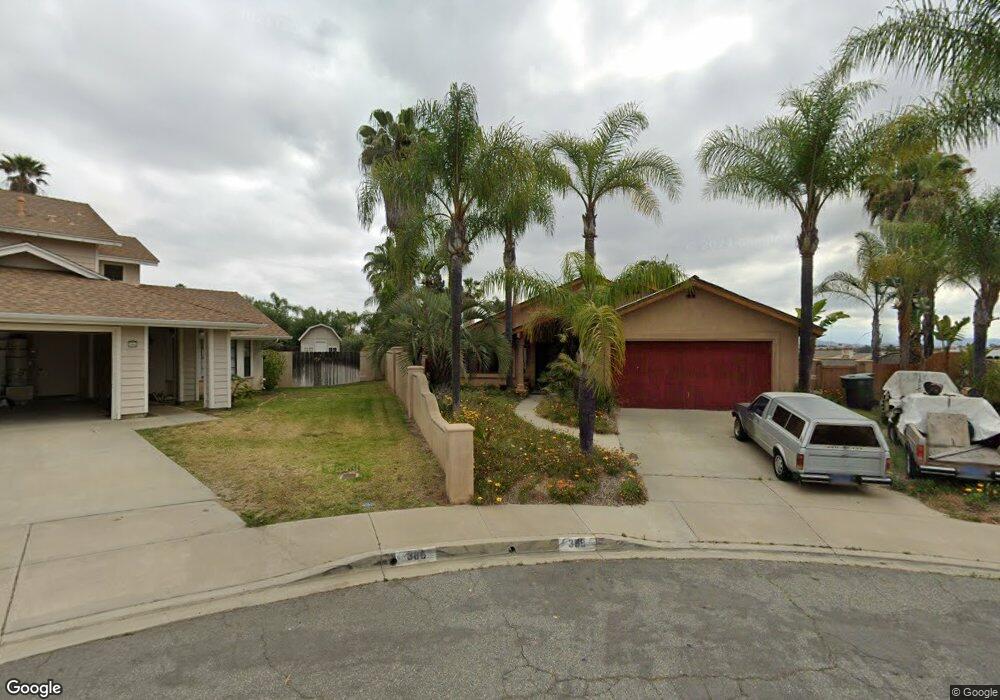
398 Pippin Dr Fallbrook, CA 92028
Estimated Value: $699,000 - $757,000
4
Beds
2
Baths
1,400
Sq Ft
$516/Sq Ft
Est. Value
About This Home
This home is located at 398 Pippin Dr, Fallbrook, CA 92028 and is currently estimated at $722,807, approximately $516 per square foot. 398 Pippin Dr is a home located in San Diego County with nearby schools including La Paloma Elementary School, James E. Potter Intermediate School, and Fallbrook High School.
Ownership History
Date
Name
Owned For
Owner Type
Purchase Details
Closed on
Oct 11, 1999
Sold by
Sharon Cameron
Bought by
Cameron Chris
Current Estimated Value
Home Financials for this Owner
Home Financials are based on the most recent Mortgage that was taken out on this home.
Original Mortgage
$30,000
Interest Rate
8.2%
Mortgage Type
Stand Alone Second
Purchase Details
Closed on
Jun 19, 1992
Purchase Details
Closed on
Sep 2, 1986
Create a Home Valuation Report for This Property
The Home Valuation Report is an in-depth analysis detailing your home's value as well as a comparison with similar homes in the area
Home Values in the Area
Average Home Value in this Area
Purchase History
| Date | Buyer | Sale Price | Title Company |
|---|---|---|---|
| Cameron Chris | -- | Gateway Title Company | |
| -- | $165,000 | -- | |
| -- | $117,700 | -- |
Source: Public Records
Mortgage History
| Date | Status | Borrower | Loan Amount |
|---|---|---|---|
| Closed | Cameron Chris | $30,000 |
Source: Public Records
Tax History
| Year | Tax Paid | Tax Assessment Tax Assessment Total Assessment is a certain percentage of the fair market value that is determined by local assessors to be the total taxable value of land and additions on the property. | Land | Improvement |
|---|---|---|---|---|
| 2025 | $3,011 | $291,744 | $75,506 | $216,238 |
| 2024 | $3,011 | $286,025 | $74,026 | $211,999 |
| 2023 | $2,927 | $280,418 | $72,575 | $207,843 |
| 2022 | $2,927 | $274,920 | $71,152 | $203,768 |
| 2021 | $2,832 | $269,530 | $69,757 | $199,773 |
| 2020 | $2,856 | $266,767 | $69,042 | $197,725 |
| 2019 | $2,802 | $261,538 | $67,689 | $193,849 |
| 2018 | $2,759 | $256,411 | $66,362 | $190,049 |
| 2017 | $2,703 | $251,384 | $65,061 | $186,323 |
| 2016 | $2,634 | $246,456 | $63,786 | $182,670 |
| 2015 | $2,585 | $242,755 | $62,828 | $179,927 |
| 2014 | $2,535 | $238,001 | $61,598 | $176,403 |
Source: Public Records
Map
Nearby Homes
- 1024 Kiel Rd
- 508 Village View Place
- 535 Shady Glen Dr
- 206 Via Oro Verde
- 956 Woodcreek Rd
- 1003 Via Unidos
- 522 S Pico Ave
- 502 E Elder St
- 741 Rossiter Ln
- 903 Crescent Bend
- 210 S Orange Ave
- 832 Magarian Rd
- 1168 N Crescent Ridge Rd
- 868 E Alvarado St Unit 7
- 868 E Alvarado St Unit 47
- 445 Poets Square
- 0 Laurine Ln
- 1304 Farrand Rd
- 113 Gardenside Ct
- 1217 Juliette Place
Your Personal Tour Guide
Ask me questions while you tour the home.