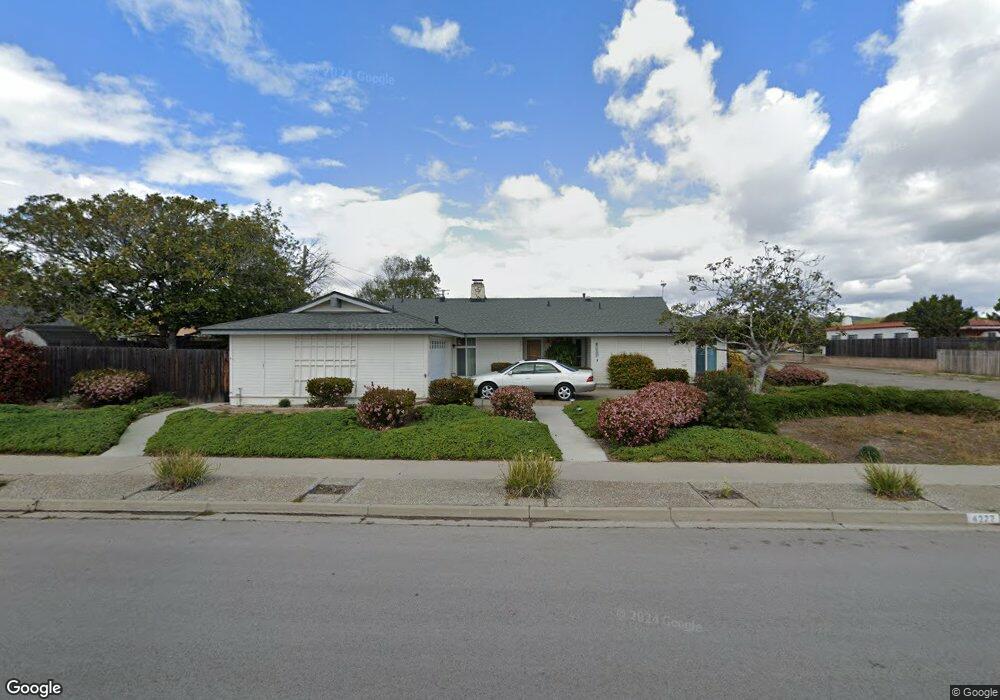
4277 Rigel Ave Lompoc, CA 93436
Estimated Value: $604,000 - $645,000
3
Beds
2
Baths
1,555
Sq Ft
$400/Sq Ft
Est. Value
About This Home
This home is located at 4277 Rigel Ave, Lompoc, CA 93436 and is currently estimated at $622,160, approximately $400 per square foot. 4277 Rigel Ave is a home located in Santa Barbara County with nearby schools including Buena Vista Elementary School, Cabrillo High School, and Olive Grove Charter - Lompoc.
Ownership History
Date
Name
Owned For
Owner Type
Purchase Details
Closed on
Jun 2, 1994
Sold by
Jones Richard E
Bought by
Hillery Stephen and Hillery Elizabeth
Current Estimated Value
Purchase Details
Closed on
Jan 5, 1994
Sold by
Jones Richard E
Bought by
Jones Richard E and The Richard E & Noreen H Jones Family Tr
Create a Home Valuation Report for This Property
The Home Valuation Report is an in-depth analysis detailing your home's value as well as a comparison with similar homes in the area
Home Values in the Area
Average Home Value in this Area
Purchase History
| Date | Buyer | Sale Price | Title Company |
|---|---|---|---|
| Hillery Stephen | -- | -- | |
| Jones Richard E | -- | -- | |
| Jones Richard E | -- | -- |
Source: Public Records
Tax History
| Year | Tax Paid | Tax Assessment Tax Assessment Total Assessment is a certain percentage of the fair market value that is determined by local assessors to be the total taxable value of land and additions on the property. | Land | Improvement |
|---|---|---|---|---|
| 2025 | $3,402 | $288,542 | $99,181 | $189,361 |
| 2023 | $3,402 | $277,340 | $95,331 | $182,009 |
| 2022 | $3,348 | $271,903 | $93,462 | $178,441 |
| 2021 | $3,381 | $266,573 | $91,630 | $174,943 |
| 2020 | $3,348 | $263,841 | $90,691 | $173,150 |
| 2019 | $3,298 | $258,668 | $88,913 | $169,755 |
| 2018 | $3,252 | $253,597 | $87,170 | $166,427 |
| 2017 | $3,108 | $248,625 | $85,461 | $163,164 |
| 2016 | $2,784 | $243,751 | $83,786 | $159,965 |
| 2015 | $2,763 | $240,091 | $82,528 | $157,563 |
| 2014 | -- | $235,389 | $80,912 | $154,477 |
Source: Public Records
Map
Nearby Homes
- 4447 Falcon Dr
- 113 Gemini Ave
- 232 Vega Ave
- 18 Galaxy Way
- 6 Stanford Cir
- 73 Stanford Cir
- 3939 Mesa Circle Dr
- 3922 Mesa Circle Dr
- 3916 Mesa Circle Dr Unit A
- 372 Oak Hill Dr
- 240 Oak Hill Dr
- 0 Oak Hill Dr Unit 24-783
- 4166 Oakwood Ct
- 4173 Oakwood Ct
- 250 Saint Andrews Way
- 649 Burning Tree Way
- 4473 Greenbrier Rd
- 384 Falcon Crest Dr
- 372 Falcon Crest Dr
- 3843 Cassini Cir Unit 3
Your Personal Tour Guide
Ask me questions while you tour the home.