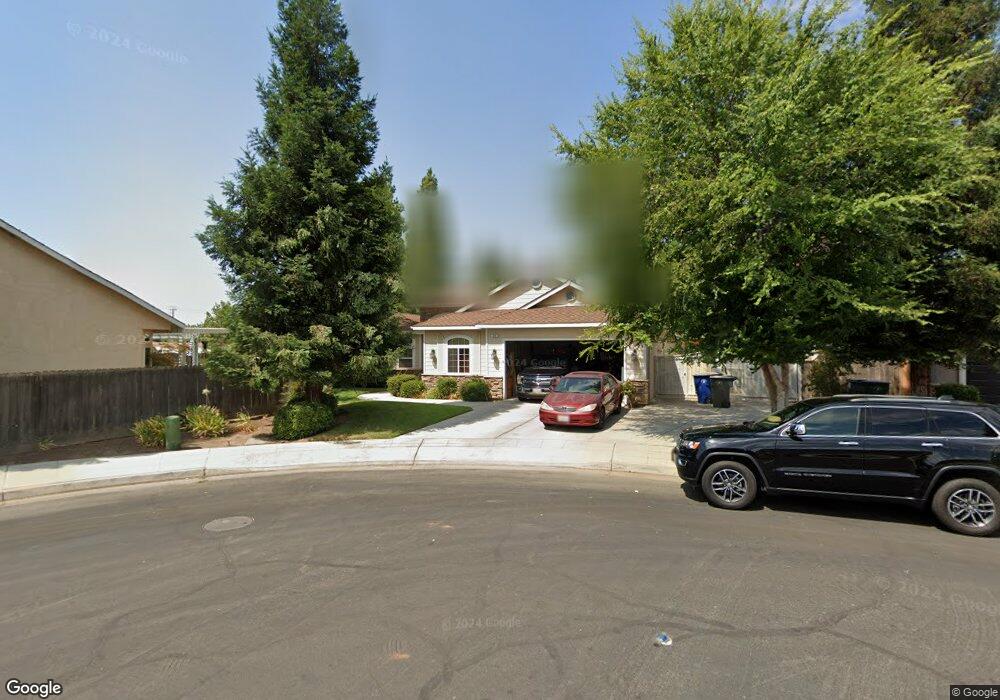
64 N Lind Ave Clovis, CA 93612
Estimated Value: $573,414 - $683,000
4
Beds
3
Baths
2,499
Sq Ft
$245/Sq Ft
Est. Value
About This Home
This home is located at 64 N Lind Ave, Clovis, CA 93612 and is currently estimated at $612,471, approximately $245 per square foot. 64 N Lind Ave is a home located in Fresno County with nearby schools including Cole Elementary School, Alta Sierra Intermediate School, and Buchanan High School.
Ownership History
Date
Name
Owned For
Owner Type
Purchase Details
Closed on
Jun 30, 2011
Sold by
Srd Investments Inc
Bought by
Link Evan and Rojas Karla
Current Estimated Value
Home Financials for this Owner
Home Financials are based on the most recent Mortgage that was taken out on this home.
Original Mortgage
$253,409
Interest Rate
4.25%
Mortgage Type
FHA
Purchase Details
Closed on
Apr 21, 2011
Sold by
Lor Bee R and Lor Mai X
Bought by
Srd Investments Inc
Purchase Details
Closed on
Dec 20, 2004
Sold by
Century Developers Llc
Bought by
Lor Bee R and Lor Mai X
Home Financials for this Owner
Home Financials are based on the most recent Mortgage that was taken out on this home.
Original Mortgage
$319,859
Interest Rate
1%
Mortgage Type
New Conventional
Create a Home Valuation Report for This Property
The Home Valuation Report is an in-depth analysis detailing your home's value as well as a comparison with similar homes in the area
Home Values in the Area
Average Home Value in this Area
Purchase History
| Date | Buyer | Sale Price | Title Company |
|---|---|---|---|
| Link Evan | $260,000 | Placer Title Company | |
| Srd Investments Inc | $183,500 | None Available | |
| Lor Bee R | $400,000 | First American Title Ins Co |
Source: Public Records
Mortgage History
| Date | Status | Borrower | Loan Amount |
|---|---|---|---|
| Previous Owner | Link Evan | $253,409 | |
| Previous Owner | Lor Bee R | $319,859 | |
| Closed | Lor Bee R | $39,982 |
Source: Public Records
Tax History
| Year | Tax Paid | Tax Assessment Tax Assessment Total Assessment is a certain percentage of the fair market value that is determined by local assessors to be the total taxable value of land and additions on the property. | Land | Improvement |
|---|---|---|---|---|
| 2025 | $3,949 | $340,214 | $62,796 | $277,418 |
| 2023 | $3,797 | $327,005 | $60,358 | $266,647 |
| 2022 | $3,745 | $320,594 | $59,175 | $261,419 |
| 2021 | $3,639 | $314,309 | $58,015 | $256,294 |
| 2020 | $3,624 | $311,088 | $57,421 | $253,667 |
| 2019 | $3,553 | $304,990 | $56,296 | $248,694 |
| 2018 | $3,474 | $299,011 | $55,193 | $243,818 |
| 2017 | $3,274 | $281,384 | $54,111 | $227,273 |
| 2016 | $3,162 | $275,867 | $53,050 | $222,817 |
| 2015 | $3,113 | $271,725 | $52,254 | $219,471 |
| 2014 | $3,054 | $266,403 | $51,231 | $215,172 |
Source: Public Records
Map
Nearby Homes
- 1234 No Address Available
- 288 W Magill Ave
- 351 N Peach Ave
- 127 5th St
- 131 N Terry Ave
- 474 W Windsor Ave
- 345 Sylmar Ave
- 560 W Stuart Ave
- 445 Quill Ln
- 142 9th St
- 103 Poppy Ln
- 742 W Ellery Ave
- 595 Quill Ln
- 484 W Balsam Ln
- 1001 Sylmar Ave Unit 3
- 1001 Sylmar Ave Unit 131
- 1001 Sylmar Ave Unit 99
- 1001 Sylmar Ave Unit 100
- 1001 Sylmar Ave Unit 126
- 1001 Sylmar Ave Unit 155
- 54 N Lind Ave
- 108 W Menlo Ave
- 74 N Lind Ave
- 121 W Menlo Ave
- 24 N Lind Ave
- 24 N Lind Ave
- 122 W Menlo Ave
- 77 W Menlo Ave
- 94 N Lind Ave
- 106 W Paul Ave
- 133 W Menlo Ave
- 120 W Paul Ave
- 134 W Menlo Ave
- 95 W Sierra Ave
- 67 W Menlo Ave
- 83 N Lind Ave
- 105 W Sierra Ave
- 75 W Sierra Ave
- 53 N Lind Ave
- 132 W Paul Ave
Your Personal Tour Guide
Ask me questions while you tour the home.